The assessment here remains that the global manufacturing PMI new orders index peaked in May and will fall through H2 2021, reflecting a decline in global six-month real narrow money growth from July 2020 through May. Real money growth, however, stabilised between May and June, raising the possibility that a turning point was at hand. A recovery in real money trends during Q3 would be a positive signal for economic prospects for H1 2022 and could support a second leg of the reflation trade.
Incoming monetary news for July is unfavourable for this scenario. Global six-month real narrow money growth is estimated to have fallen further last month to its lowest since October 2019, based on monetary data covering 70% of the G7 plus E7 aggregate monitored here – see chart 1.
Chart 1

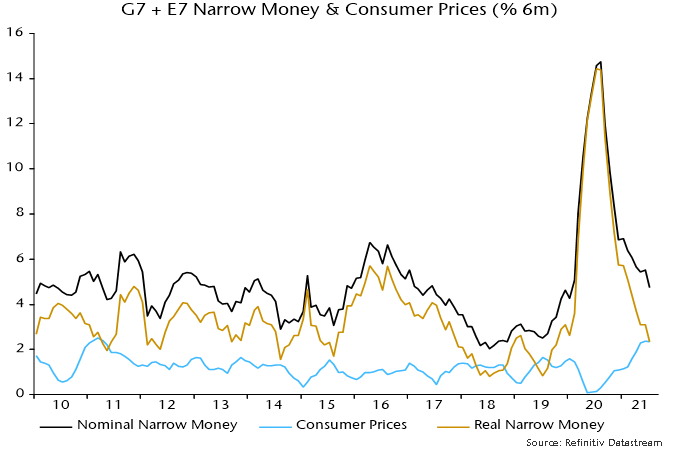
A pick-up in six-month consumer price inflation contributed to the fall in real narrow money growth into May / June. Price momentum stabilised in July but there was a further decline in nominal money expansion – chart 2.
Chart 2

Six-month real narrow money growth is estimated to have fallen in the US, China, Japan and Brazil, with India stable – chart 3. (The US July money number is estimated from weekly data on currency in circulation and commercial bank deposits.)
Chart 3

A recovery in the global measure remains plausible in August / September. Recent commodity price stabilisation suggests a decline in six-month inflation, while Chinese money growth may pick up in lagged response to policy easing.
Global six-month real narrow money growth has led turning points in manufacturing PMI new orders by 6-7 months on average historically. The further fall in real money growth in July, therefore, suggests that PMI weakness will extend into early 2022.
The PMI new orders index is a good indicator of underlying industrial momentum but output was held back by supply issues during H1, disrupting the normal relationship – chart 4. Output momentum could rebound temporarily in Q3 as supply constraints ease even as the PMI moderates.
Chart 4

This possibility complicates market analysis. The performance of “traditional” cyclical equity market sectors (i.e. excluding IT and communication services) relative to defensive sectors has correlated better with PMI new orders than industrial output, suggesting that they will lag if the PMI slides – chart 5.
Chart 5

A near-term rebound in output momentum, however, could be relevant for assessing the monetary backdrop for markets. Global six-month industrial output growth fell back below real money growth in April – chart 6. The return to a positive real money / output growth gap may explain continued strength in equity market indices despite signs of economic cooling.
Chart 6

A negative cross-over, however, is possible if there is a large output catch-up effect and real money growth remains weak.
The monetary signal of an economic slowdown is starting to be confirmed by non-monetary leading indicators. Chart 7 shows six-month rates of change of composite indices based on the OECD’s methodology but calculated independently. The suggestion is that the loss of economic momentum now clearly visible in China will be mirrored in the US and the rest of the G7 in H2 2021.
Chart 7
