This year’s surge in global broad money is expected here to result in a significant inflation pick-up in 2021-22. The timing, magnitude and sustainability of this rise, however, are uncertain, the latter depending importantly on the extent to which broad money trends normalise over coming quarters.
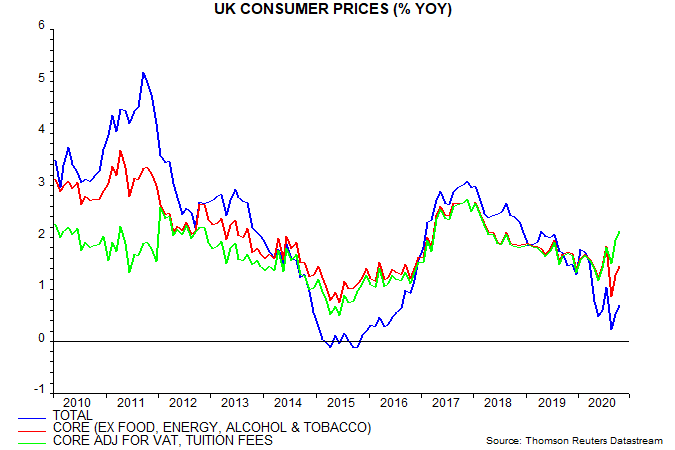
Are there early signs of a pick-up? The UK has often been a bellwether of rising global inflationary pressures, perhaps reflecting the historical weakness of its policy institutions. UK headline CPI inflation remains well below target but the underlying rate is significantly higher and rising.
The UK inflation debacles of the 1970s and late 1980s predated Bank of England independence. Recent signals from the Bank, however, have been less than reassuring: the new Governor has emphasised the Bank's role in ensuring low government financing costs, while the quarterly policy report was changed to remove “inflation” from the title, with recent editions containing no discussion of the monetary surge.
The headline CPI rate rose in October but, at 0.7%, remains far below the 2% target. The current low level, however, is entirely explained by weakness in energy and, to a lesser extent, food prices, along with the temporary cut in VAT in the hospitality sector.
The conventional core rate excluding food, energy, alcohol and tobacco was 1.5% in October. The underlying measure calculated here also excludes student tuition fees, which were a distorting factor in some recent years, while attempting to correct for VAT changes. The latter adjustment requires an estimate of the extent to which changes are passed on to consumers: a conservative assumption of 35% is used for the hospitality cut. On this basis, underlying inflation is estimated at 2.1% in October, representing a significant rise from a May low of 1.2% – see first chart.

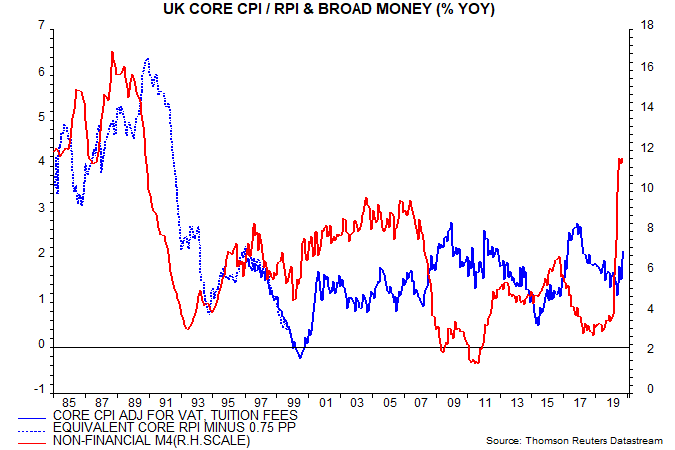
Research on post-WW2 UK data conducted in 2016* found a convincing leading relationship between turning points in annual broad money growth and underlying inflation, with a variable lead time averaging 26 months. The rise in the underlying rate since May is consistent with a recovery in broad money growth, as measured by non-financial M4, from a low in November 2018 – second chart.

Money growth, however, remained modest through February 2020. The subsequent surge, coupled with covid-related cost pressures, may have advanced and magnified the expected inflation increase. Money growth may be peaking but underlying inflation is likely to trend higher until late 2021, at least, even allowing for a shorter than average lead time.
Exchange rate developments can temporarily disrupt the money-inflation relationship. A 24% rise in sterling’s effective rate in 1996-97, for example, advanced and magnified an inflation decline in the late 1990s, when the relationship appears to become coincident – second chart. Conversely, a 25% sterling drop in 2007-08 delayed an inflation fall signalled by a collapse in money growth into 2011. Recent exchange rate moves have been small, with the effective rate currently 2% lower than a year ago.
The third chart shows possible paths for headline and underlying CPI inflation consistent with the above analysis. The projections assume:
- 1) A rebound in energy prices in 2021 as the global economy grows strongly, resulting in a 10% rise in the Ofgem energy price cap and vehicle fuel costs returning to late 2019 levels.
- 2) A rise in CPI food inflation from 0.6% in October to 2.0% by end-2021, reflecting recent and expected further increases in food commodity prices and additional EU supply chain costs.
- 3) No further extension of the 5% VAT rate in hospitality beyond the planned 31 March end date, with 35% pass-through of the subsequent rise.
- 4) A 2.25% pa rate of increase in the underlying CPI measure tracked here, marginally higher than the estimated 2.1% annual rise in the year to October.

Headline CPI inflation averages 3.2% in Q4 2021 compared with a Bank of England central projection of 2.1%. The assumptions are arguably conservative, with possibilities of more pronounced commodity price strength as the global economy rebounds and a larger rise in underlying inflation following the monetary surge.
*Report available on request.