The big news in last week’s US GDP release was a huge downward revision to corporate profits growth in recent years.
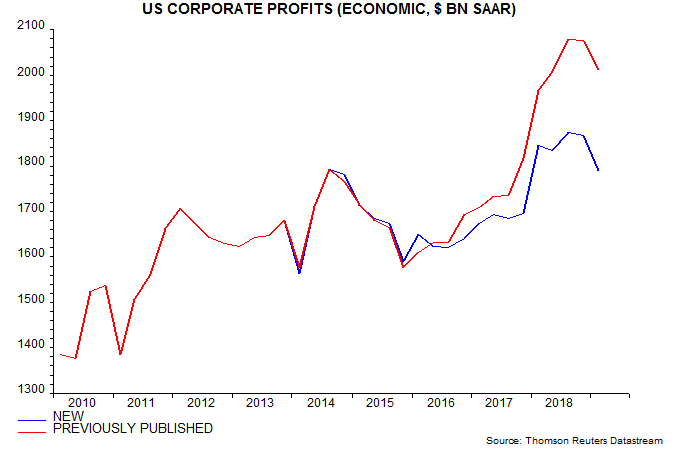
The national accounts measure of post-tax “economic” profits – adjusted for stock appreciation and to reflect “true” depreciation of capital assets – was revised down from $2,031 billion to $1,855 billion for 2018, a cut of 8.7%. Profits in Q1 2019 were unchanged from Q3 2014 – see first chart.

The downward revision reflected the incorporation of comprehensive annual data from corporate tax returns. The cut in profits was balanced by upward revisions to employee compensation and net interest costs.
Last year, some analysts cited strong growth of national accounts profits as a reason for economic optimism. A post at the time warned that early national accounts numbers were often revised significantly. Real-time profits were rising immediately ahead of the last two recessions but the numbers were subsequently revised to show falls.
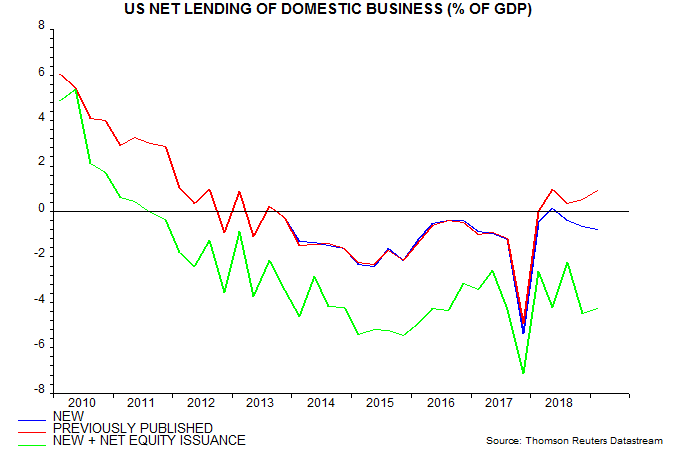
The business sector was previously reported to be a net lender to the rest of the economy in Q1 2019, with saving exceeding investment by 0.9% of GDP. The new data show a deficit of 0.8% of GDP – second chart. This excludes borrowing to finance net equity retirement – 3.5% of GDP in Q1.

The weaker financial position than previously reported supports the pessimistic view here of prospects for business investment and employment.
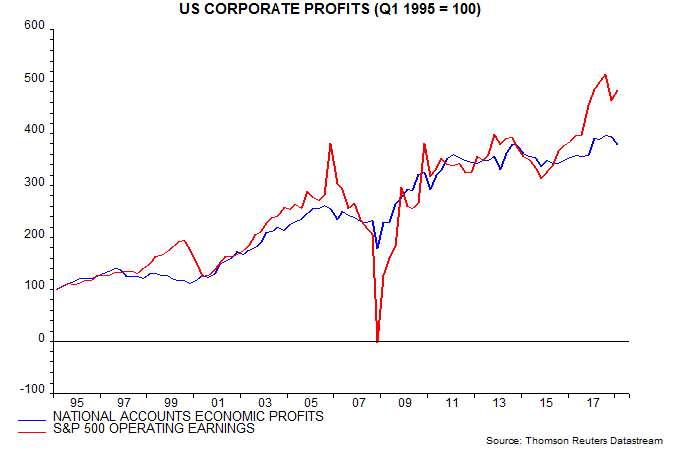
The new national accounts profits numbers show a marked divergence from S&P 500 operating earnings. The latter rose by 57% from a low in Q4 2015 through Q1 2019 versus an increase of only 13% in the national accounts series – third chart.

One reason for the difference is that the national accounts series encompasses smaller and unquoted companies – S&P 500 operating earnings are equivalent to about two-thirds of the national accounts total. Profits of these smaller firms may have been underperforming.
The national accounts series measures income from current production, excluding non-recurring items such as capital gains / losses, restructuring charges and bad debt provisions. While the definition of operating earnings is similar, the adjustments made by S&P may be less comprehensive and rely on data provided by companies in their financial statements rather than tax returns.
A similar large divergence between S&P 500 operating earnings strength and stagnant or falling national accounts (revised) profits occurred ahead of the 2001 and 2008-09 recessions and was “resolved” by a subsequent decline in S&P earnings.