The OECD’s composite leading indicator indices are showing brighter signs, consistent with the view here that global economic growth will recover after a weak start to 2016.
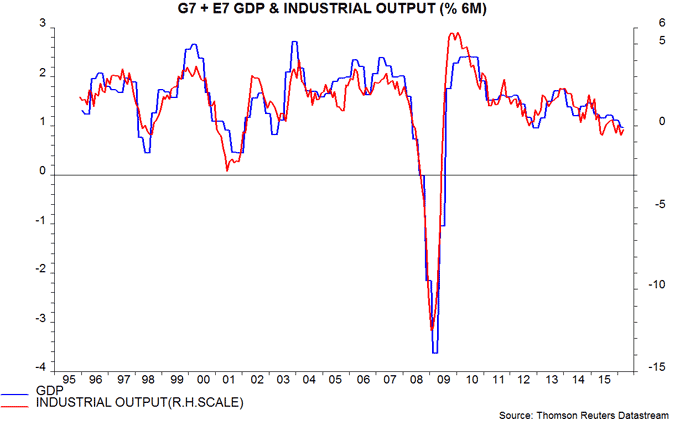
Available data suggest that two-quarter GDP growth in the G7 major countries and seven large emerging economies (the “E7”) slipped to its lowest level since 2012 in the first quarter of 2016. (Growth is measured over two quarters to reduce volatility.) G7 plus E7 industrial output, meanwhile, was stagnant over the six months to March – see first chart.
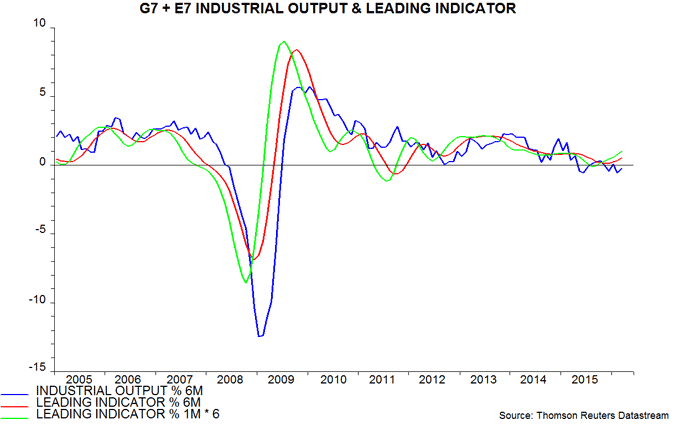
The second chart shows changes in industrial output and a G7 plus E7 leading indicator based on the OECD’s country data. Six-month growth of the indicator rose again in March, having bottomed in November 2015. The one-month indicator change also continues to firm.
The upturn in leading indicator momentum is consistent with a rise in G7 plus E7 six-month real narrow money growth from a low in August 2015 – third chart. The latter pick-up was noted in a post at end-2015, which concluded that “global economic momentum will remain soft in early 2016 but rise in the spring / summer”. (Note that real narrow money has expanded consistently faster than industrial output / GDP in recent years, reflecting super-low interest rates, which have reduced the opportunity cost of holding demand / sight deposits and physical cash. Changes in real money growth, however, continue to foreshadow changes in economic expansion six to 12 months ahead.)
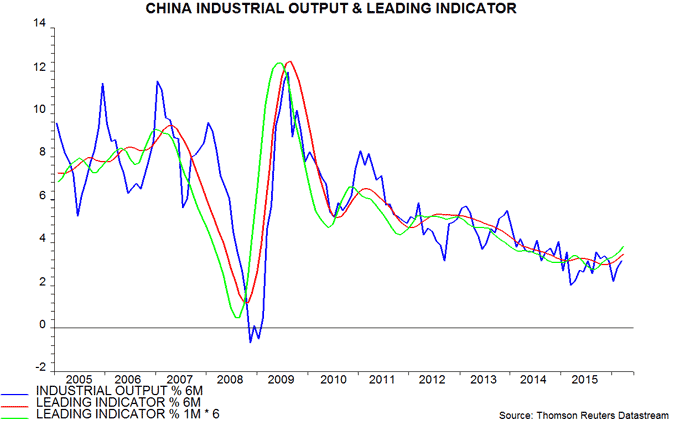
The stronger signal from the leading indicator mainly reflects an upturn in the E7 component, although G7 weakness is abating. The OECD’s Chinese leading indicator, in particular, is giving a positive message, consistent with an earlier upswing in real narrow money growth – fourth chart. A recent resurgence of pessimism about Chinese economic prospects appears premature, at least.