Global monetary growth remained strong in September, suggesting that the current upswing in economic momentum will be sustained through mid-2017 (at least), based on the historical average nine-month lead from money to output.
Annual growth of narrow money in the G7 major economies and seven large emerging economies (the “E7”) rose to 11.7% in September, the fastest since 2009 (slightly exceeding a 2011 peak of 11.6%). Broad money growth firmed to 7.5%, the fastest since 2013 – see first chart.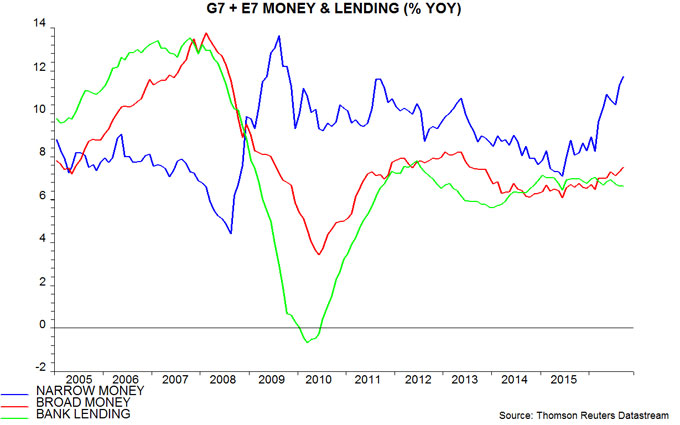
The forecasting approach here emphasises the six-month growth rate of real (i.e. consumer price-adjusted) narrow money. This edged down in September from August’s seven-year high, reflecting both a decline in nominal expansion and higher inflation. There was a similar downtick in six-month real broad money growth – second chart.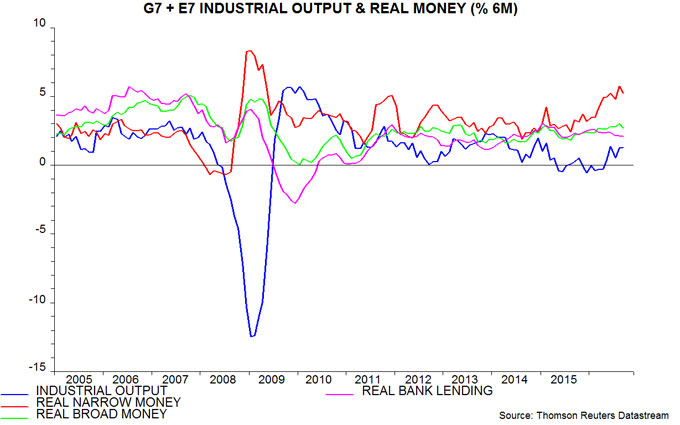
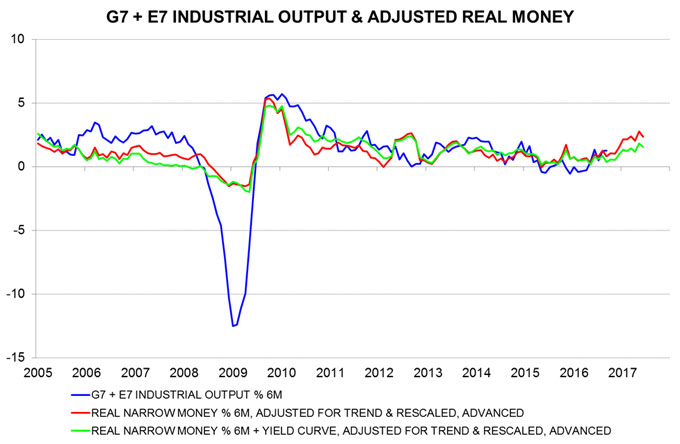
The third and fourth charts show adjusted real narrow money growth measures. The red line applies the historical average nine-month lead from real money to output and also adjusts for a long-run downward trend in the rate of change of narrow money velocity. The green line additionally incorporates the slope of the G7 government yield curve, which has also performed impressively as a leading indicator historically (but may be less reliable now because of central bank manipulation of bond markets). As the fourth chart shows, current G7 plus E7 industrial output growth is broadly in line with the “forecasts”, which are signalling a further pick-up in momentum through spring 2017.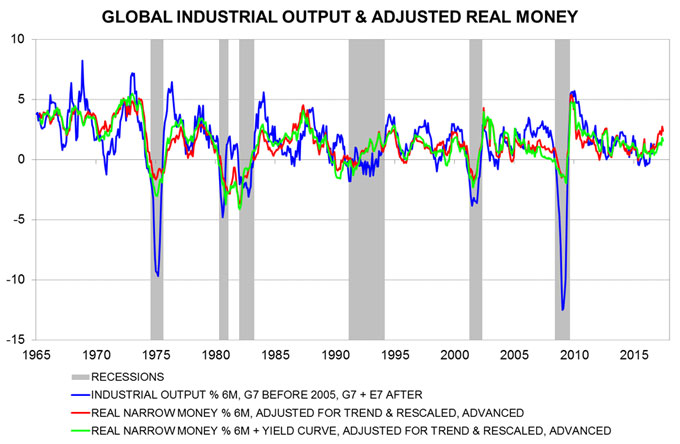
The small decline in G7 plus E7 six-month real narrow money growth in September reflected a fall in the G7 component, which is nonetheless much stronger than a year ago. E7 real money growth, by contrast, rose to a new six-year high – fifth chart.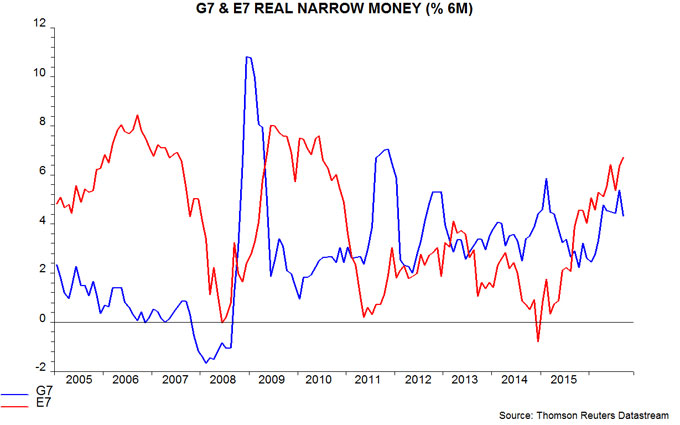
Six-month real narrow money growth rates are similar across the major developed economies. Japan remains at the top, consistent with recent equity market outperformance, with the UK in the middle, arguing against the consensus view that UK GDP growth will be below the G7 average in 2017 – sixth chart.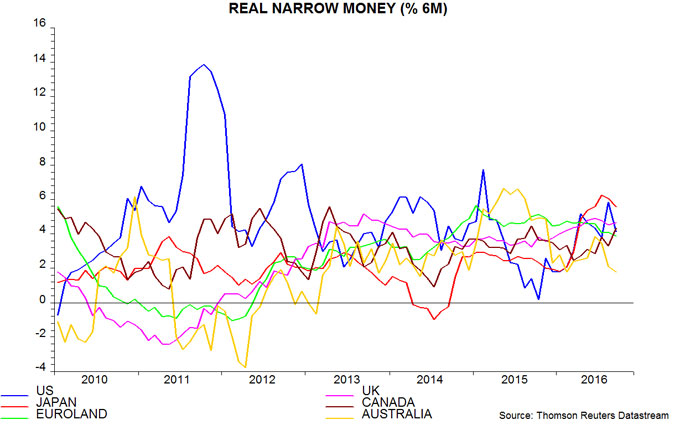
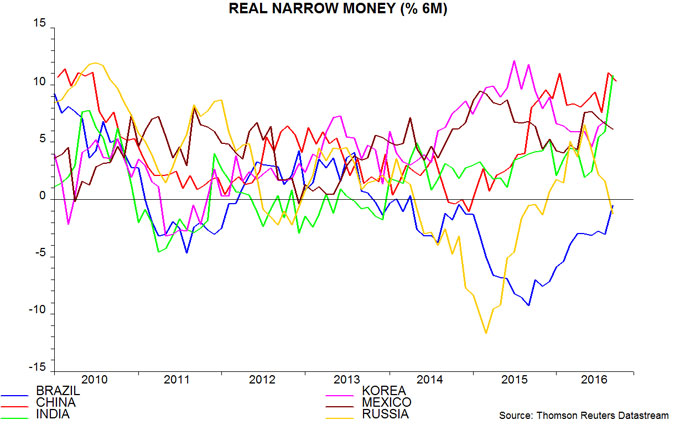
In the E7, Indian real narrow money growth has surged to match Chinese buoyancy. Brazilian weakness is abating but a renewed contraction in Russia suggests that recovery hopes will be disappointed – seventh chart.