Entries from January 29, 2012 - February 4, 2012
China: no "hard landing" but economy subdued
 Simon Ward
 Post a Comment
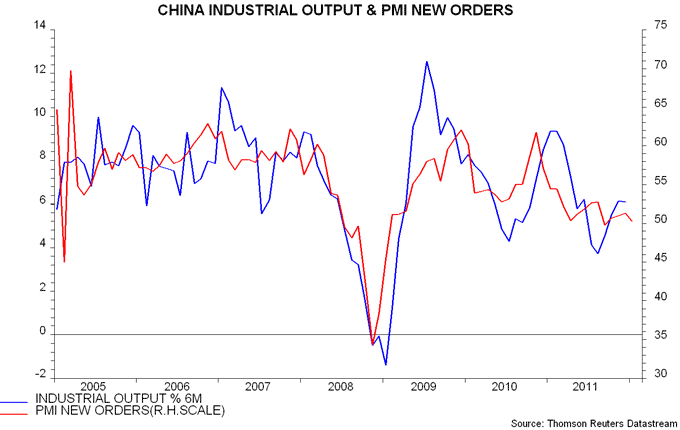
Concerns here about a Chinese “hard landing” eased in late 2011 as real money expansion revived on the back of policy actions and slowing inflation. Six-month growth in real M1, however, was still below average in December, suggesting moderate rather than strong economic prospects – see previous post.
Yesterday’s official manufacturing PMI results, showing the highest new orders reading since October, could be interpreted as supporting a more upbeat outlook. The official numbers, however, fluctuate seasonally, despite supposedly being adjusted for such variation. After applying Datastream’s seasonal adjustment algorithm, new orders slipped back in January – see chart. Based on the historical relationship, the current reading of a little over 50 is consistent with six-month industrial output expansion of about 5%, or 10-11% annualised – below a long-term average of 15-16%.
The “big picture”, therefore, is that China was in danger of a crash landing last summer but a subsequent easing of monetary conditions seems to have stabilised growth at a slightly below-trend pace. Such a scenario would be promising for markets, implying that China continues to contribute significantly to global economic expansion while domestic inflationary pressures ease at the margin, allowing further gradual policy loosening.
Eurozone credit crunch eased by ECB lending boost
The ECB’s latest bank lending survey confirms a significant tightening of credit conditions but forward-looking components are marginally less grim, probably reflecting the ECB’s three-year lending operation.
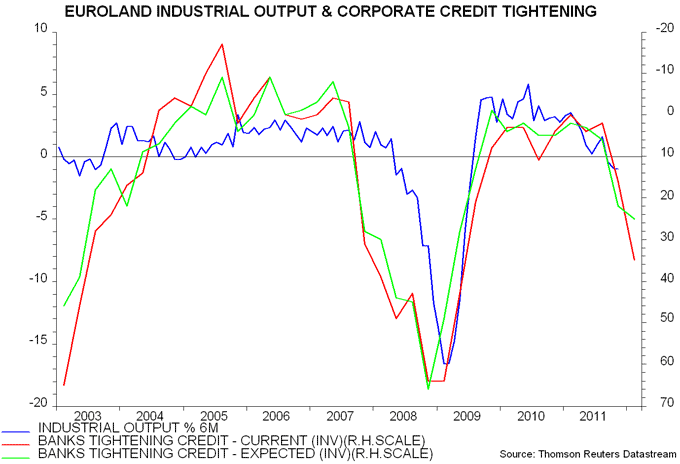
The net percentage of banks tightening credit standards on business loans rose to 35% last quarter, the highest since 2009 and similar to the level in early 2008 before a collapse in industrial output – see chart. This confirms a message of weakness from last week’s monetary data – see previous post.
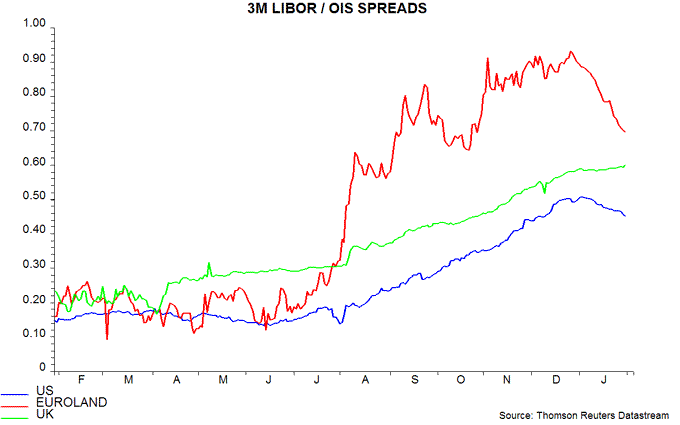
The balance planning to tighten standards in the current quarter, however, was lower, at 25%, reflecting an expectation of less difficult wholesale funding conditions following the ECB’s decision to extend the maturity of its liquidity support and loosen collateral requirements further. Banks, presumably, will have been encouraged by a thawing of markets since the survey was conducted in late December / early January, with the key three-month LIBOR / OIS spread subsiding from more than 90 to below 70 basis points.
UK monetary statistics: QE offset by bank retrenchment
UK money supply figures for December are a mixed bag but suggest that the economy will continue to struggle during the first half of 2012. The positive monetary impact of QE has been offset by bank disposals of non-domestic assets, probably in response to funding difficulties and regulatory pressure to boost capital ratios. Rather than force feed more cash into the gilt market, the Bank of England should offer ECB-style longer-term liquidity support to stem further deleveraging.
Bears are likely to alight on a 2.1% fall (not annualised) in the M4 broad money supply during the fourth quarter but this measure continues to be badly distorted by falling deposits of “intermediate” financial corporations – institutions channeling interbank business whose activities have little relevance to the “real” economy. The Bank’s preferred “M4ex” measure excluding these deposits declined by 0.2% last quarter.
This latter drop, moreover, was accounted by a fall in non-intermediate financial companies’ deposits, largely due to securities dealers – probably temporary. M4 holdings of households and private non-financial corporations rose by 0.7% during the fourth quarter, implying no generalised liquidity squeeze.
These numbers, however, are disappointing against the backdrop of an estimated £50.9 billion of gilt purchases by the Bank last quarter, equivalent to 3.3% of the M4ex measure. The counterparts analysis of M4 changes indicates that the positive monetary impact of QE was offset by banks’ efforts to contract their balance sheets, specifically by cutting their net external and foreign currency assets – by £28.2 billion over the quarter. Domestic assets, by contrast, were spared, with M4ex lending actually rising by £15.8 billion or 0.8%.
Monetary trends are probably not recessionary but faster expansion is necessary to revive economic growth. Further QE is unlikely to achieve this goal without accompanying action to enable banks to fund their balance sheets. The Bank insiders who control monetary and financial policy, however, refuse to contemplate ECB-style lender-of-last-resort operations – despite their hardline approach having resulted in a worse banking crisis in the UK than elsewhere in 2008-09.
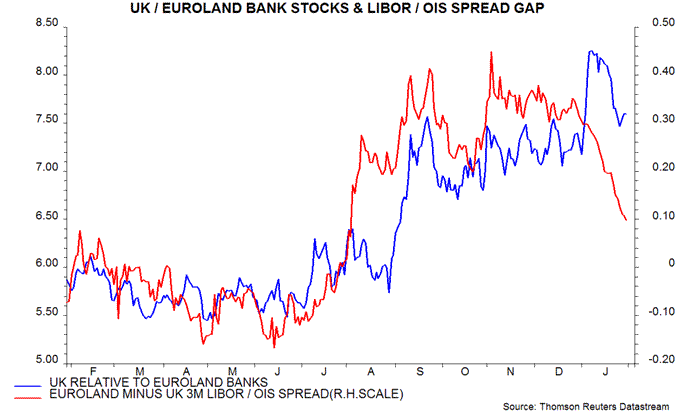
The more hostile policy environment for banks in the UK than in Euroland has been reflected in a continued grind higher in the sterling three-month LIBOR / OIS spread even as the equivalent euro spread has fallen sharply – see first chart. This divergence has been reflected in UK bank stocks recently underperforming their Eurozone equivalents, following a large relative gain last year – second chart.
Is the US recession scare over?
US recession fears have dissipated in response to stronger-than-expected economic news in recent months. The expectation here remains that the economy will grow respectably during 2012 but the data flow may turn more mixed near term, triggering renewed recession worries.
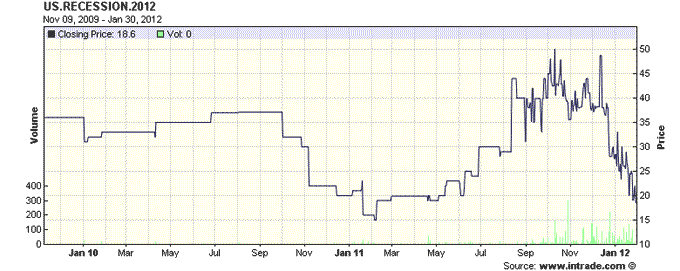
Fears reached a peak last autumn soon after a 30 September recession call by the highly-regarded Economic Cycle Research Institute (ECRI). The Intrade prediction market 2012 US recession contract topped at $5.0 on 10 October, implying a 50% probability of two consecutive quarterly GDP declines – see first chart. (The contract pays out $10 if the latter condition is met in 2012 and zero otherwise.)
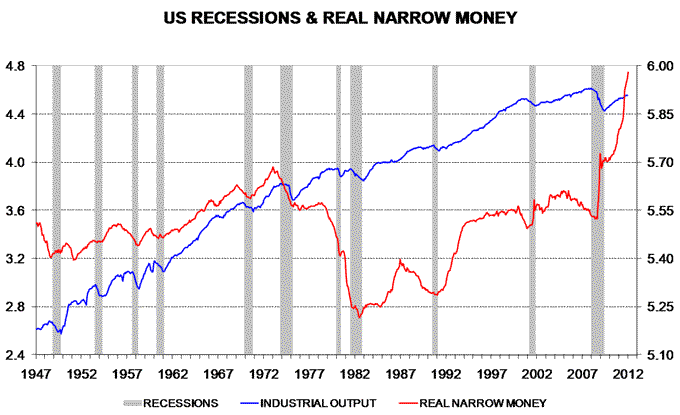
A post in early October argued that a recession would be highly unusual against a backdrop of rapid real money expansion. 10 out of 11 post-war US downturns were preceded by a contraction of the real narrow money supply – second chart. The exception was the 1953-54 recession, apparently caused by severe fiscal tightening as defence spending was slashed after the Korean war.
The monetarist view seemed to receive support in late 2011 as economic news surprised positively, contributing to a fall in the Intrade contract. The implied probability rebounded towards 50% in mid December after the ECRI reaffirmed its recession call but has since collapsed to below 20% – first chart. (The contract closed last week at $1.86.)
Economic news, however, could turn less favourable near term, reviving recession nerves. Activity is likely to have been artificially boosted in late 2011 by businesses bringing forward spending on capital goods (including autos) ahead of a reduction in the bonus depreciation allowance from 100% to 50% – this boost should turn to a drag in early 2012. A rise in stocks last quarter increases the risk that any demand set-back will be reflected in lower production.
In addition, some analysts argue that seasonal adjustments to economic data were unduly favourable in late 2011, with the effect likely to unwind during the first half of 2012. Adjustment algorithms, it is claimed, have been distorted by a collapse in activity in late 2008 / early 2009, part of which is being wrongly assigned to normal seasonal variation, with the pattern extrapolated to later years.
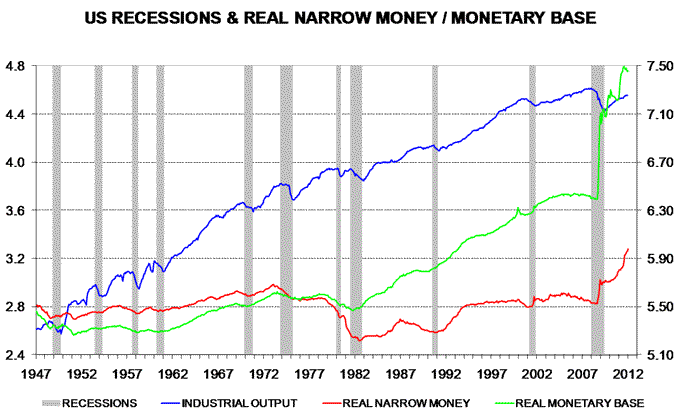
Monetarist analysis continues to suggest a low probability of a recession but is less clear-cut than last autumn. Real narrow money is still expanding and has been the best single monetary indicator of downturns. Real broad money, however, has slowed while the real monetary base has fallen since July – third chart.