Global "double dip" on track
 Simon Ward
 3 Comments
A “double dip” in the global economy suggested by monetary trends appears to be playing out, with weakness likely to intensify into late 2023.
The global composite PMI new orders index – a timely coincident indicator – continued its decline from a May peak last month. A relapse had been suggested by a fall in six-month real narrow money momentum from December 2022 – see chart 1.
Chart 1
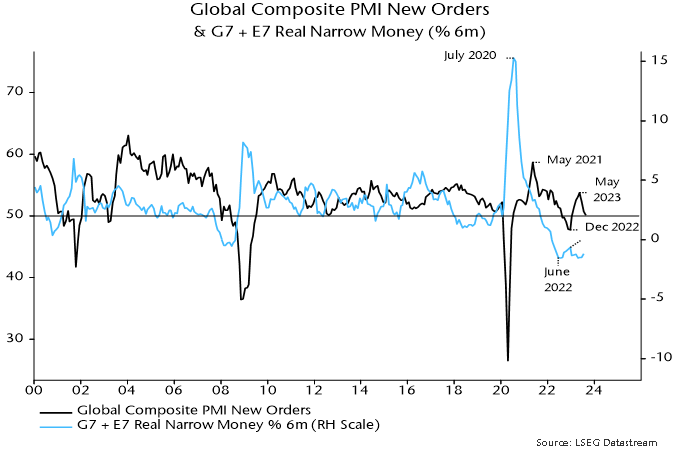
The year-to-date low in real money momentum occurred in April but there was little recovery through July and another decline is possible. The suggestion is that the PMI will fall further into Q4 and remain weak into early 2024.
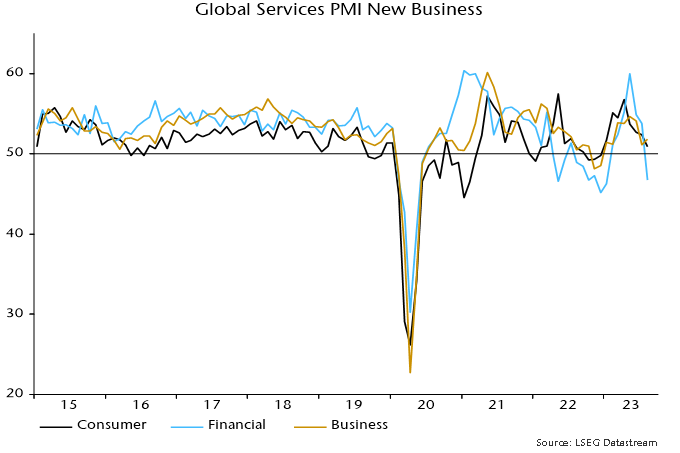
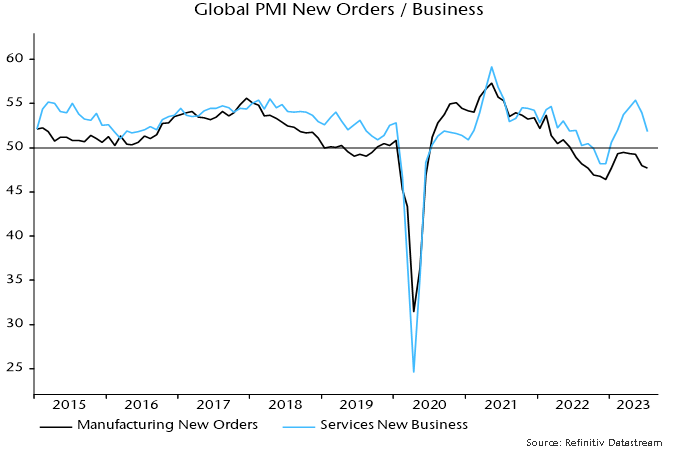
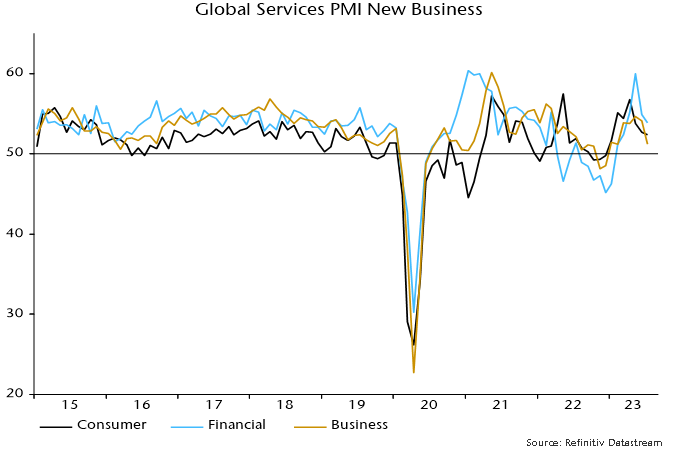
As expected, the composite PMI fall is being driven by services converging down towards weak manufacturing – chart 2. The August decline in services new business reflected a plunge in demand for financial services and a further consumer slowdown, with a partial offset from a minor recovery in business services after a larger July drop – chart 3.
Chart 2
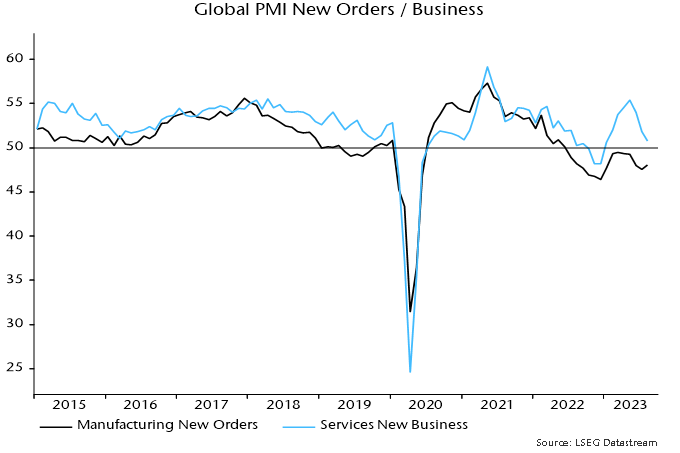
Chart 3
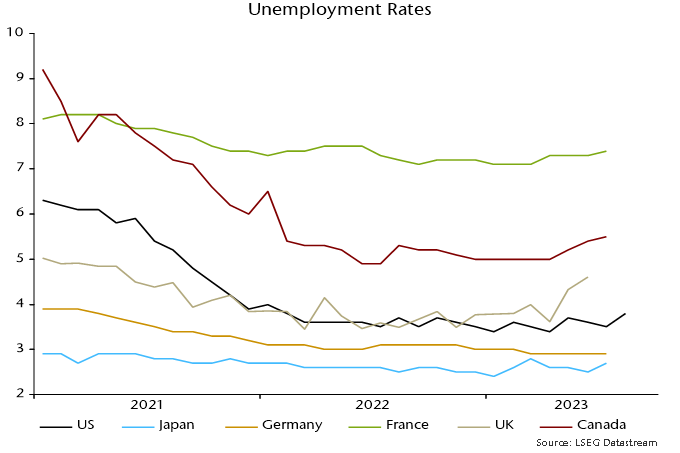
The ending of the services mini-boom, which fuelled recent employment gains, suggests a faster loosening of labour markets. Unemployment rates have reached 12+ month highs in the US, France, the UK and Canada, while a rise appears to be under way in Japan – chart 4.
Chart 4
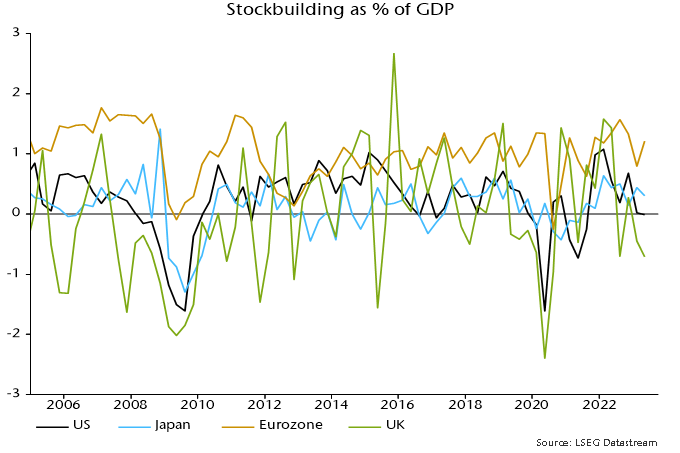
Previous posts suggested that a bottoming out of the stockbuilding cycle would support manufacturing new orders later in 2023. The cycle downswing, however, could be extended by delayed inventory cut-backs in the Eurozone: stockbuilding bounced back in Q2 as final demand contracted sharply, with recent adjustment lagging far behind the US / UK – chart 5.
Chart 5
Disastrous European monetary data
Eurozone / UK July money numbers offer further support to the assessment here that ECB / Bank of England policy tightening has been excessive and – unless reversed swiftly – will cause unnecessarily severe economic weakness and a medium-term inflation undershoot.
The latest releases are astonishing in several respects.
Six-month real narrow money momentum hit a new low in the Eurozone in July and is even weaker in the UK despite a recent boost from falling six-month CPI inflation. Readings are much worse than elsewhere and historically extreme – see charts 1-3.
Chart 1
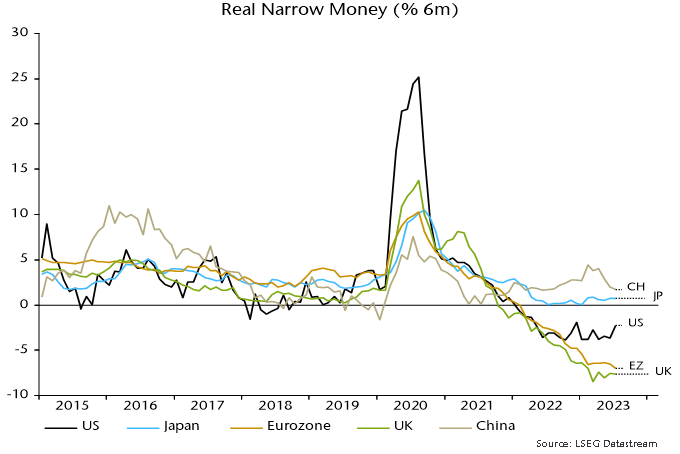
Chart 2
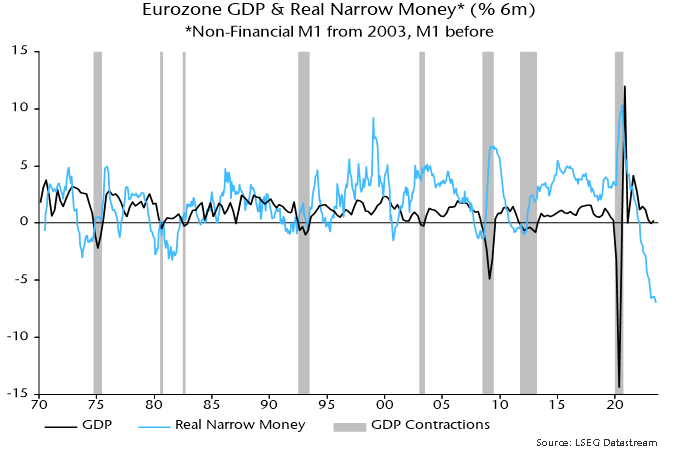
Chart 3
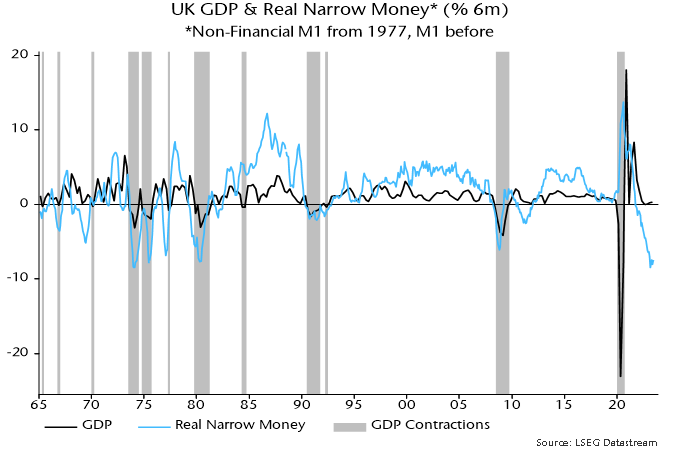
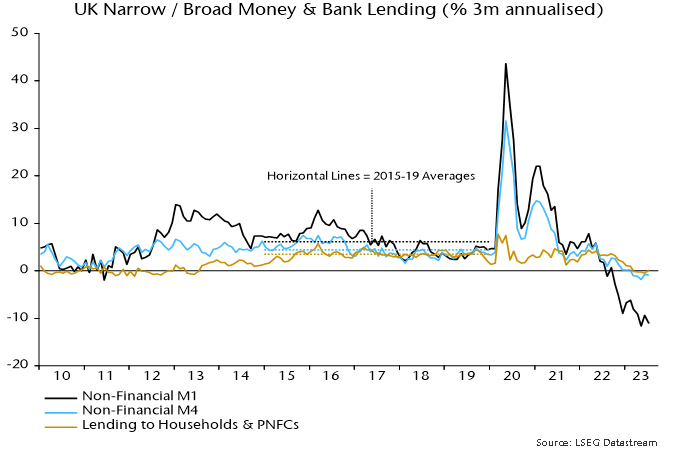
Broad money has followed narrow into nominal contraction. The preferred broad measures here, i.e. Eurozone non-financial M3 and UK non-financial M4, fell at annualised rates of 0.8% and 0.9% respectively in the three months to July – charts 4 and 5.
Chart 4
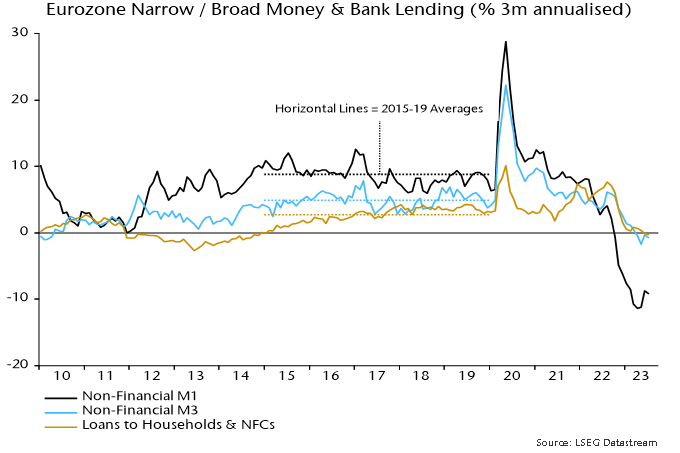
Chart 5
Broad money declines are rare: since 1970, the Eurozone / UK three-month changes were negative only for a brief period around the GFC, with the falls of similar magnitude to recently.
Money leads the economy while credit is coincident / lagging. Bank lending to households and non-financial firms is starting to contract, consistent with recessions being under way – charts 4 and 5.
A further notable feature of the Eurozone data is a widening divergence between still-rising bank deposits in Germany and falls elsewhere – chart 6.
Chart 6
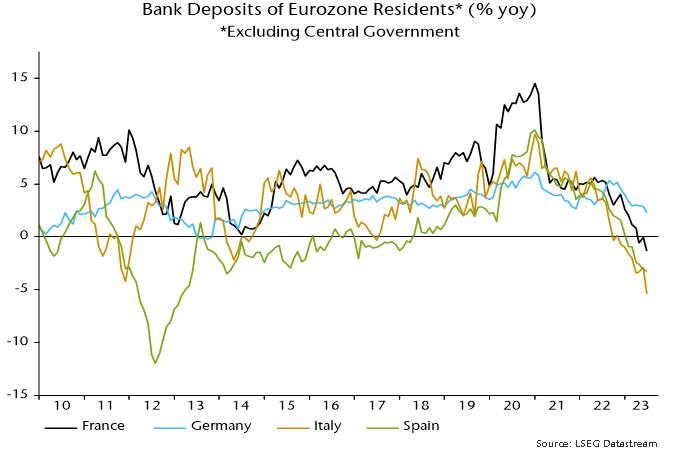
A similar core / periphery monetary divergence in 2011 warned of an escalating Eurozone crisis. The driver then was capital flight from the periphery, reflected in a ballooning of national central bank TARGET deficits / surpluses.
The Bundesbank’s TARGET surplus has fallen recently. Rather than capital flows, the relative resilience of German broad money is explained by less pronounced weakness in bank lending – chart 7.
Chart 7
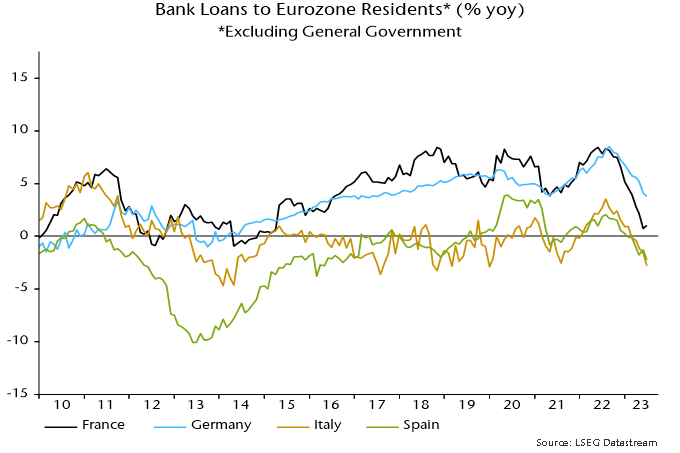
So money / credit trends suggest that economic prospects in the rest of the Eurozone are at least as bad as in Germany.
Eurozone six-month CPI momentum, meanwhile, continues to track a simplistic monetarist forecast based on the profile of broad money growth two years earlier – chart 8. Six-month headline momentum was unchanged at 3.3% annualised in August but core slowed further to 4.0%, a 17-month low.
Chart 8
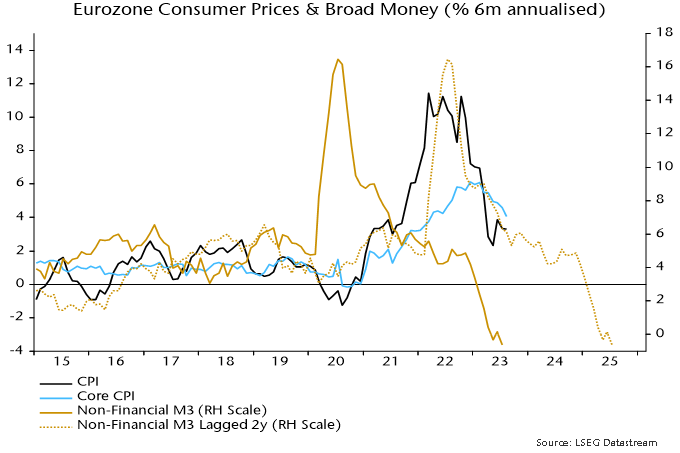
The suggestion is that six-month headline momentum will reach 2% next spring, with the annual rate following during H2. A subsequent significant undershoot is indicated unless recent monetary weakness is reversed.
Why have real yields risen?
Why have global government bond yields picked up over the summer despite weakening PMIs and neutral / favourable inflation news?
The rise is attributed here to a further deterioration in the global “excess” money backdrop driven partly by unexpected output strength as an easing of supply constraints has allowed firms to work off order backlogs. Output is expected to realign with weak / falling incoming demand during H2, suggesting a reversal of liquidity tightening.
The rise in nominal yields has been driven by the real component with inflation expectations little changed.
Changes in real yields have been inversely correlated historically with changes in global “excess” money momentum, as measured by the differential between six-month rates of change of real narrow money and industrial output – see chart 1.
Chart 1
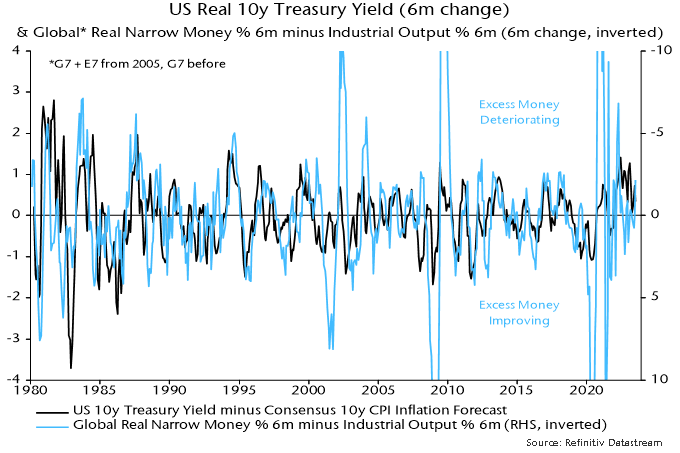
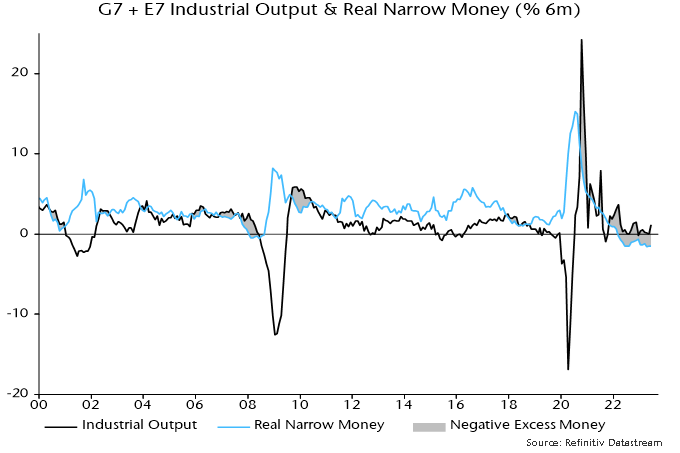
This differential has been negative since early 2022 but was expected to narrow as monetary tightening fed through to weaker economic activity and slowing inflation lifted real money momentum. Instead, industrial output growth rose to a seven-month high in June while nominal money weakness has offset a disinflation boost to real momentum – see chart 2.
Chart 2
Production resilience was signalled by a recovery in the global manufacturing PMI output index, which crossed 50 in February on the way to a May high. It moved back below breakeven in June / July, however, with August flash results suggesting a return to the December 2022 level or lower – see chart 3.
Chart 3
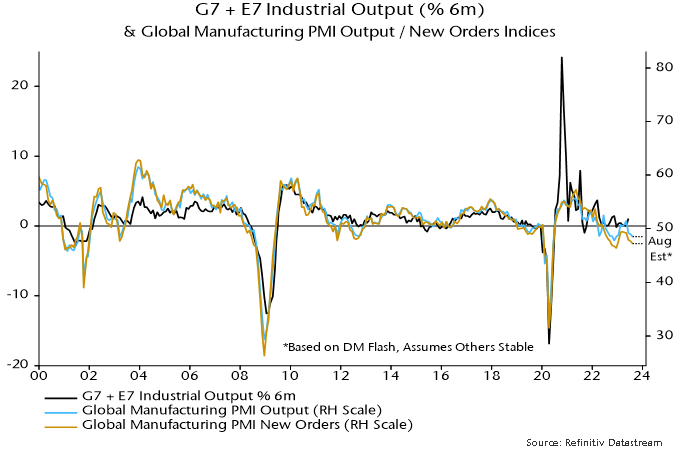
Covid-related supply disruption resulted in the PMI output index lagging the new orders index in 2021 / H1 2022, but the position has reversed over the past year as production bottlenecks have eased, allowing firms to fulfil outstanding orders.
With the PMI delivery speed index – an inverse indicator of bottlenecks – hitting a 14-year high in May, the supply catch-up is probably ending, suggesting that the PMI output index – and hard production data – will converge with weaker new orders. At the current level of the latter index, this would imply output contraction.
The real narrow money / industrial output momentum differential, therefore, is likely to narrow unless nominal money data weaken further and / or consumer price inflation rebounds (unlikely). While G7 tightening is still feeding through, stable / easier monetary policies are expected to promote money growth recoveries in EM.
Commentaries here have suggested that the monetary / economic backdrop would favour quality stocks in 2023. The MSCI World quality index is 7.1% ahead of MSCI World in price terms year-to-date (as of yesterday’s close). This mainly reflects a high weighting in tech, but the sector-neutral quality index (which imposes MSCI World sector weights) is also now outperforming the main index and has reversed its relative weakness in 2022 – see chart 4.
Chart 4
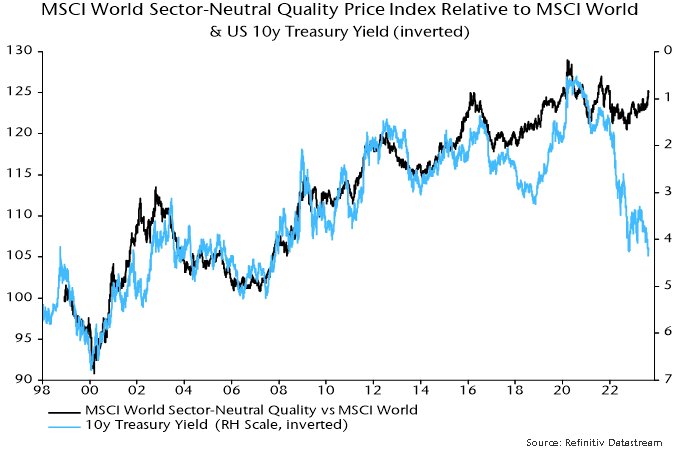
The recent relative gain is striking against the backdrop of rising Treasury yields, with which the style has been inversely correlated historically, as the chart shows. The divergence is reminiscent of 2018, when the quality relative embarked on a sustained rise in February but a fall in Treasury yields was delayed until November. This year’s quality rally also started in February, suggesting a resolution of the current disconnect with yields by year-end.
Chinese weakness due to policy misstep
Pessimistic commentators argue that the Chinese economy has entered a “liquidity trap” and faces Japan-style deflation. This assessment is not shared here: a recent monetary slowdown can be explained by misguided policy tightening around end-2022, which is now being reversed, while broad money growth would need to fall much further to suggest a sustained decline in prices.
A review of monetary policy in recent years is helpful in understanding current conditions. An important consideration is that – like the Fed decades ago – the PBoC does not announce changes in its policy stance, which often become apparent only after the event in movements in money market rates and credit / monetary trends.
The PBoC eased policy between late 2020 and summer 2022 to cushion covid-related economic weakness. Three-month SHIBOR fell from over 3% to 1.5%, while six-month growth rates of money and credit began to pick up from mid-2021 – see charts 1 and 2.
Chart 1
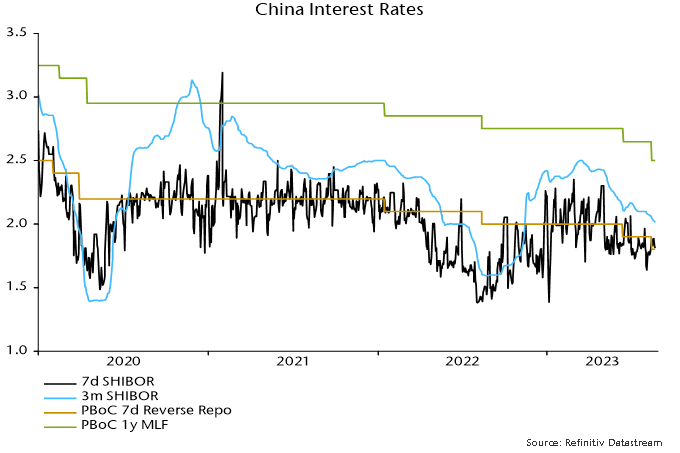
Chart 2
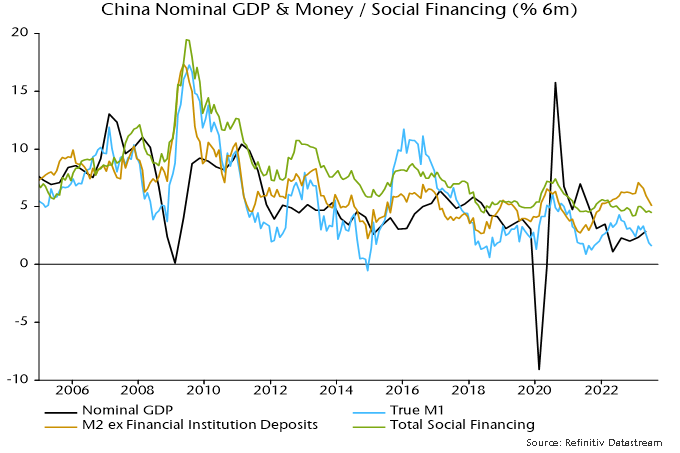
Narrow and broad money measures continued to accelerate in H1 2022, laying the foundations for a solid post-reopening economic recovery in H1 2023 – real GDP grew by 6.1% annualised between Q4 2022 and Q2 2023.
The PBoC, however, blotted its copy book in late 2022, tightening policy on misplaced concern about a reopening-driven inflation pick-up, although narrow money and credit growth were by then cooling and the ratio of broad money to nominal GDP was close to trend (in contrast to the US / Europe, where a large monetary overhang fuelled strong price pressures).
Three-month SHIBOR rebounded from 1.7% in September to 2.4% by year-end, rising further to 2.5% in March. The consensus view at the time – not shared here – was that the rise in money rates reflected stronger money demand due to reopening, i.e. the increase was “endogenous” rather than policy-driven and would not threaten economic prospects.
Policy tightening has resulted in six-month narrow and broad money growth falling to late 2021 levels, although credit expansion has declined by less (despite a very weak July flow number) – chart 2. The monetary slowdown suggests a loss of economic momentum through late 2023.
The PBoC has, at least, been swift to recognise its error, resuming easing in early Q2. Three-month SHIBOR has retraced half of its August-March rise but may need to return to the low to offset recent monetary damage.
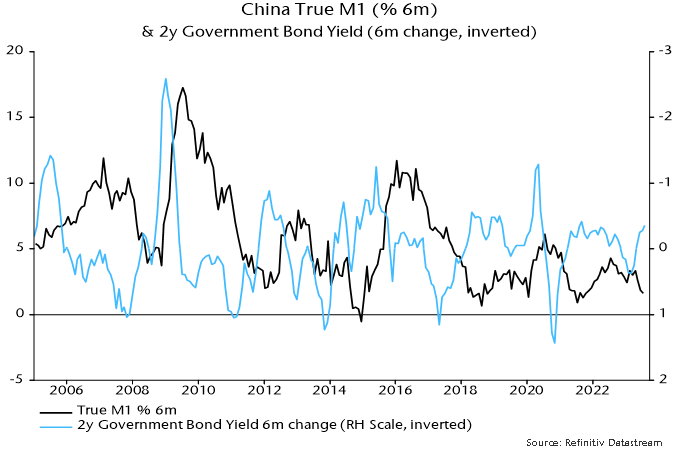
Chart 3 illustrates the inverse leading relationship between changes in interest rates (in this case the two-year government yield) and narrow money momentum. The reversal in rates suggests a bottoming out and revival in money momentum, although timing is uncertain.
Chart 3
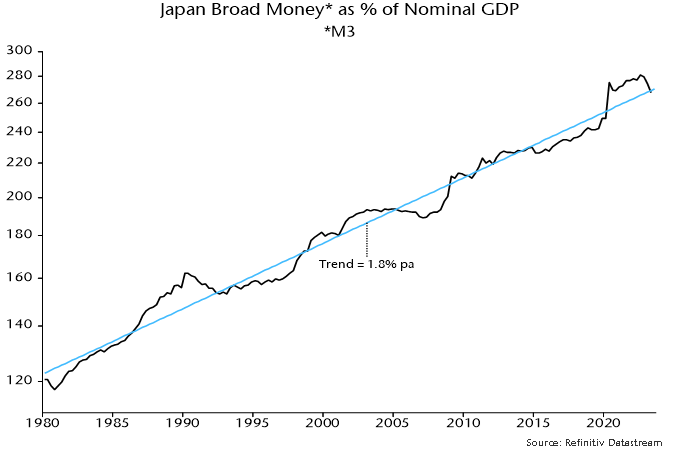
Why did Japan enter a sustained deflation in the early 1990 and are there parallels with current Chinese conditions?
From a monetary perspective, a deflationary environment requires (broad) money growth to fall below the sum of trend real GDP growth and the trend rise in the money / nominal GDP ratio.
The ratio of Japanese broad money M3 to nominal GDP has risen by 1.8% pa on average over the long run – chart 4. Trend real GDP growth was running at about 2% in the early 1990s, so broad money needed to expand by about 4% pa to maintain stable prices. Annual growth fell below this level in 1991 on the way to zero in 1992, averaging 2.7% over 1991-2000.
Chart 4
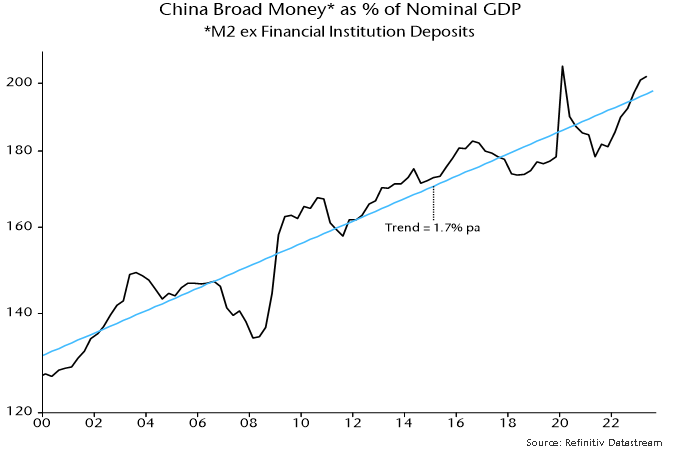
China’s broad money to nominal GDP ratio has risen at a similar trend rate of 1.7% pa – chart 5. If trend real GDP growth is assumed to be about 5%, broad money expansion needs to stay above about 7% to avoid a deflationary scenario. Annual growth is currently 11.6%, with the six-month rate of increase at 10.4% pa.
Chart 5
PMI / monetary data confirming global "double dip"
A recovery in global economic momentum into the spring has gone into reverse, with monetary trends suggesting that weakness will intensify during H2.
The global composite PMI new orders index fell sharply again in July and has now retraced half of its December-May rise – see chart 1. The relapse was foreshadowed by a decline in global six-month real narrow money momentum from a local peak in December 2022. Real money momentum retested its June 2022 low in April and has since moved sideways, suggesting a further slide in the PMI index into early Q4 followed by stabilisation.
Chart 1
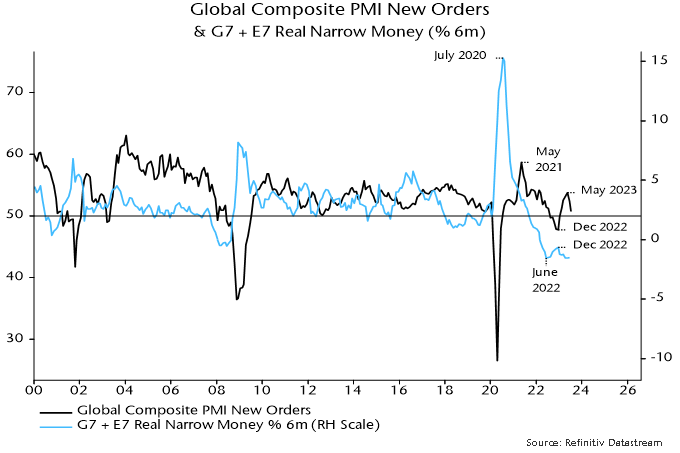
The December-May recovery in global PMI new orders was boosted by several non-monetary factors, including release of pent-up demand for services, China’s reopening and gas price relief in Europe. With similar tailwinds unlikely during H2, the orders index may retest or break the December 2022 low.
The July orders decline was paced by a slowdown in services new business, although manufacturing demand also weakened further – chart 2. The services-manufacturing gap remains wide and is expected to close via the former moving into contraction, with manufacturing possibly stabilising as the stockbuilding cycle bottoms.
Chart 2
The July PMI orders decline was broadly based across sectors. Within manufacturing, consumer goods joined investment and intermediate goods in contraction – chart 3. Services demand slowed across consumer, financial and business segments – chart 4.
Chart 3
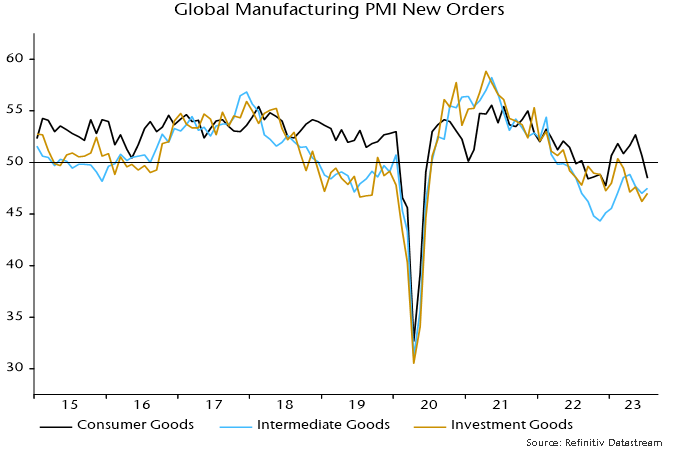
Chart 4
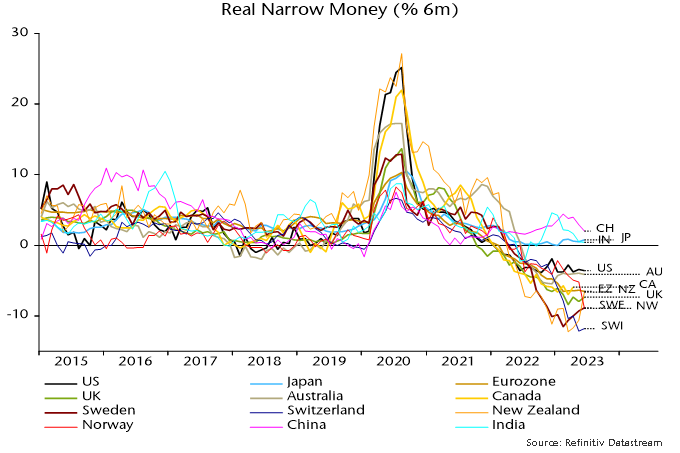
Six-month real narrow money momentum remains weakest in Europe and has slowed in China and India – chart 5. With policy tightening still feeding through, and recent oil price strength acting to slow a decline in six-month CPI momentum, global real money momentum may fail to recover during Q3.
Chart 5