PMIs weaken on schedule; earnings next?
 Simon Ward
 Post a Comment
DM flash results released last week suggest that the global manufacturing PMI new orders index fell sharply in June, having moved sideways in April and May following a Q1 recovery – see chart 1.
Chart 1
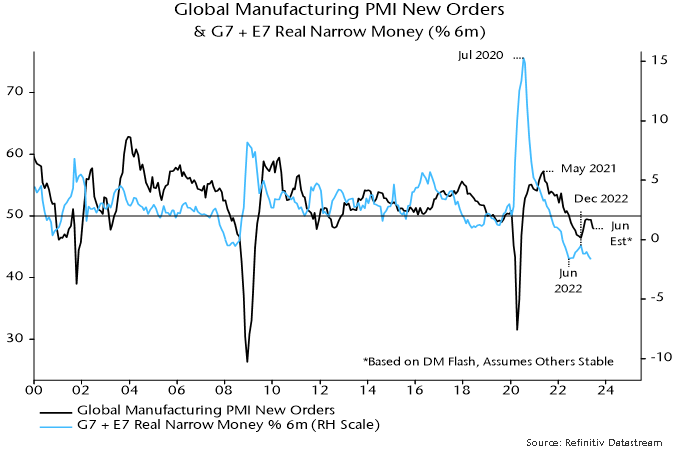
The relapse is consistent with a decline in global six-month real narrow money momentum from a local peak in December 2022. A recovery in real money momentum during H2 2022 had presaged the Q1 PMI revival.
Real narrow money momentum is estimated to have fallen again in May, based on partial data, suggesting further PMI weakness into late 2023.
The global earnings revisions ratio has been contemporaneously correlated with manufacturing PMI new orders historically but remained at an above-average level in June, widening a recent divergence – chart 2.
Chart 2
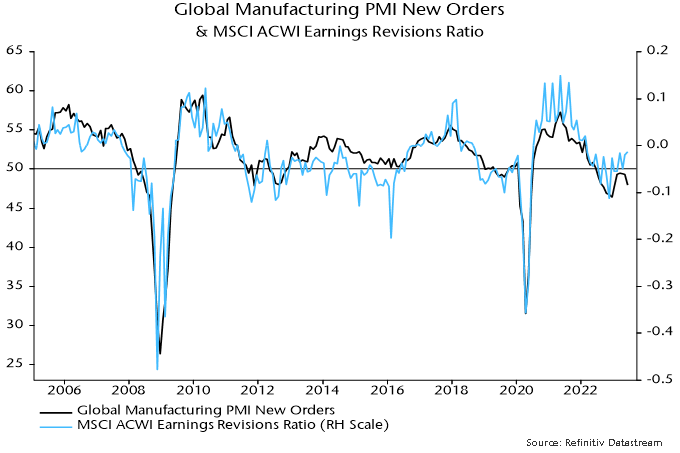
Based on monetary trends, a reconvergence is more likely to occur via weaker earnings revisions than a PMI rebound.
Charts 3 and 4 show that revisions resilience has been driven by cyclical sectors – in particular, IT, industrials and consumer discretionary. Notable weakness has been confined to the materials sector. Cyclical sectors may be at greater risk of downgrades if the global revisions ratio heads south.
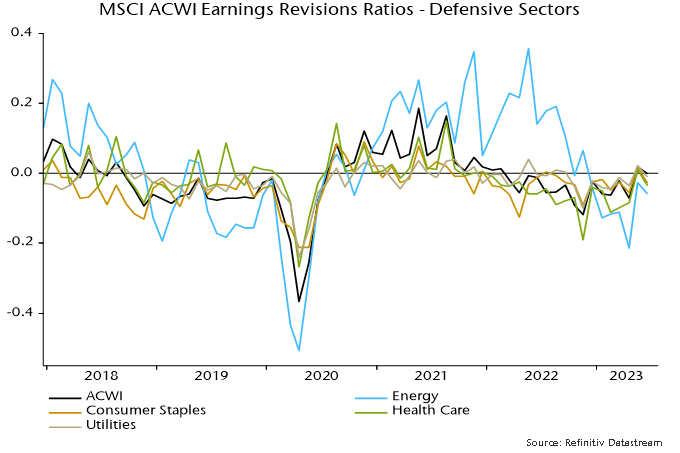
Defensive sector revisions have underperformed recently but are likely to be less sensitive to economic weakness.
Chart 3
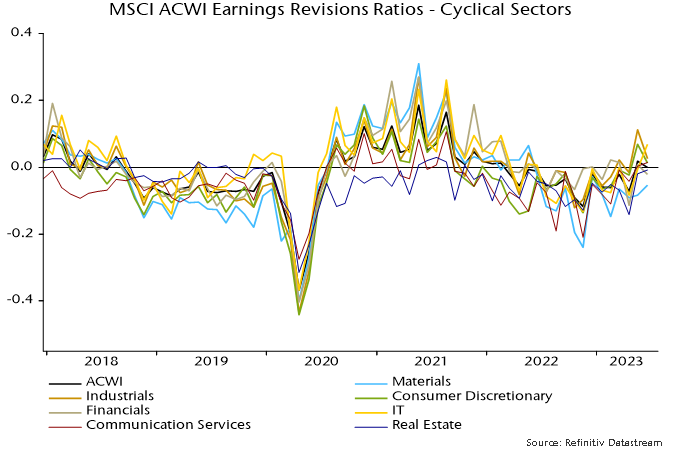
Chart 4
The positive divergence of earnings revisions from the PMI may reflect firms’ ability to push through price increases to compensate for slower volumes. The deviation of the global revisions ratio (rescaled) from manufacturing PMI new orders – i.e. the gap between the blue and black lines in chart 2 – has displayed a weak positive correlation with the PMI output price index historically (contemporaneous correlation coefficient = +0.41).
Any earnings support from pricing gains is now going into reverse: the output price index has crashed from an April 2022 peak of 63.8 to 49.8 in May, with DM flash results suggesting a further fall last month.
EM leading global inflation decline
Why believe the “monetarist” forecast that recent G7 monetary weakness will feed through to low inflation in 2024-25?
Monetary trends correctly warned of a coming inflationary upsurge in 2020 when most economists were emphasising deflation risk.
The forecast of rapid disinflation is on track in terms of the usual sequencing, with commodity prices down heavily, producer prices slowing sharply and services / wage pressures showing signs of cooling.
A further compelling consideration is that the monetary disinflation expected in G7 economies has already played out in emerging markets.
A GDP-weighted average of CPI inflation rates in the “E7” large emerging economies* crossed below its pre-pandemic (i.e. 2015-19) average in March, falling further into May – see chart 1.
Chart 1
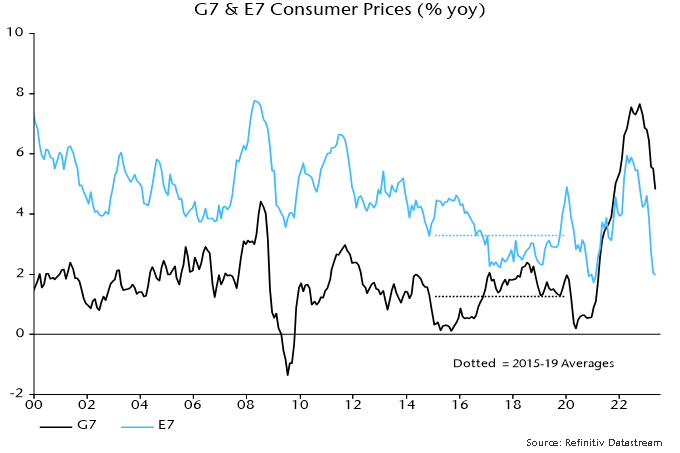
The E7 average is dominated by China but inflation rates are also below or close to pre-pandemic levels in Brazil, India and Russia.
Inflation rose by much less in the E7 than the G7 in 2021-22, opening up an unprecedented negative deviation that has persisted.
The recent plunge in the E7 measure reflects a significant core slowdown as well as lower food / energy inflation.
The divergent G7 / E7 experiences are explained by monetary trends. Annual broad money growth rose by much less in the E7 than the G7 in 2020 and returned to its pre-pandemic average much sooner – chart 2.
Chart 2

E7 broad money growth crossed below the pre-pandemic average in May 2021. CPI inflation, as noted, followed in March 2023, i.e. consistent with the monetarist rule of thumb of a roughly two-year lead from money to prices.
G7 broad money growth crossed below its pre-pandemic average in August 2022 and has yet to bottom, suggesting a return of inflation to average in summer 2024 and a subsequent undershoot.
E7 disinflation, however, may be close to an end. Annual broad money growth has recovered strongly from a low in September 2021, signalling a likely inflation rebound during 2024 – chart 3. Broad money acceleration has been driven by China, Russia and Brazil.
Chart 3
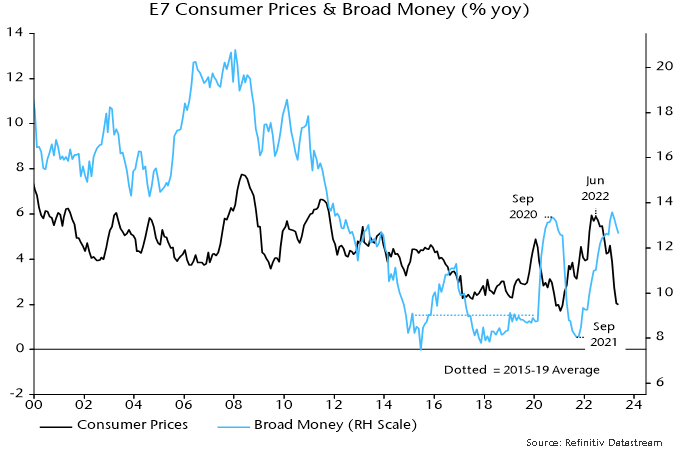
E7 annual broad money growth is around the middle of its longer-term historical range and has eased since February. Chinese numbers may have been temporarily inflated by a shift in banks’ funding mix in favour of deposits.
The expected rise in E7 inflation may not extend far but restoration of a positive E7 / G7 differential is likely in 2024.
*E7 defined here as BRIC + Korea, Mexico, Taiwan.
Fed forecasts still suggesting H2 policy shift
The FOMC’s updated economic forecast for the remainder of 2023 is inconsistent with Committee members’ median expectation of a further 50 bp rise in official rates during H2, according to a model based on the Fed’s past behaviour. Policy is more likely to be eased than tightened if the forecast plays out.
The model estimates the probability of the Fed tightening or easing each month from current and lagged values of core PCE inflation, the unemployment rate and the ISM supplier deliveries index, a measure of production bottlenecks. It provides a simple but satisfactory explanation of the Fed’s historical decision-making, i.e. the probability estimate was above 50% in most tightening months and below 50% in most easing months – see chart.
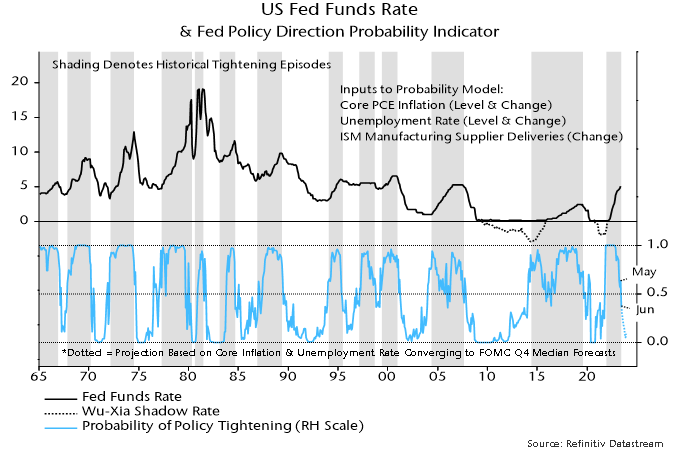
The probability of the Fed tightening at yesterday’s meeting had been estimated by the model at 36%, the first sub-50% reading since September 2021. (The FOMC started to taper QE at the following meeting in November.)
The FOMC’s median forecast for core PCE inflation in Q4 was revised up to 3.9% from 3.6% previously (currently 4.7%). The unemployment rate forecast was lowered to 4.1% from 4.5% (currently 3.7%).
The model projections shown in the chart assume that core PCE inflation and the unemployment rate converge smoothly to the Q4 forecasts, while the ISM supplier deliveries index remains at its current level. Despite the revisions, the probability estimate still falls to below 10% in Q4, consistent with the Fed beginning to ease by then.
The projections highlight the Fed’s historical sensitivity to the rates of change of core inflation and unemployment as well as their levels. It would be unusual for policy-makers to continue to tighten when inflation and unemployment are trending in the “right” directions, especially given the magnitude of the increase in rates to date.
One difference from the past is that Fed now forecasts its own actions. Has yesterday’s guidance that rates have yet to peak boxed policy-makers into at least one further rise? This may mean that the model’s probability estimate for July – currently 29% – is too low. Still, next month’s decision will hinge on data, with inertia plausible barring stronger-than-expected news.
Is services resilience about to crumble?
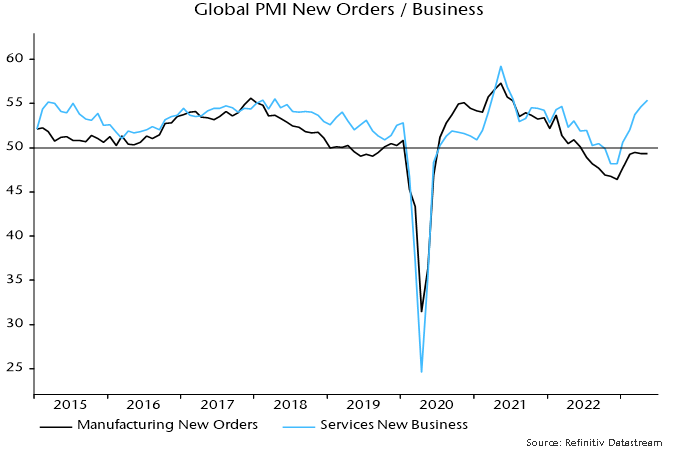
Global growth optimists expect continued solid services sector expansion to offset manufacturing weakness. PMI results for May appear, on first inspection, to support this view: services activity and new business indices rose further to 18- and 22-month highs respectively even as manufacturing new orders remained stalled below 50 – see chart 1.
Chart 1
There are, however, several reasons for discounting the strong headline services readings.
First, backlogs of services work fell sharply to a four-month low despite stronger new business – chart 2. This suggests that current output is running ahead of incoming demand, in turn implying a future adjustment lower unless demand picks up further.
Chart 2
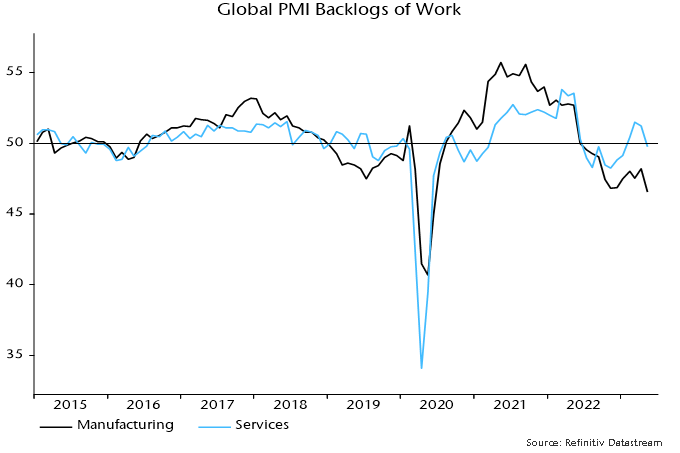
Manufacturing backlogs also fell sharply last month, breaking below their November 2022 low.
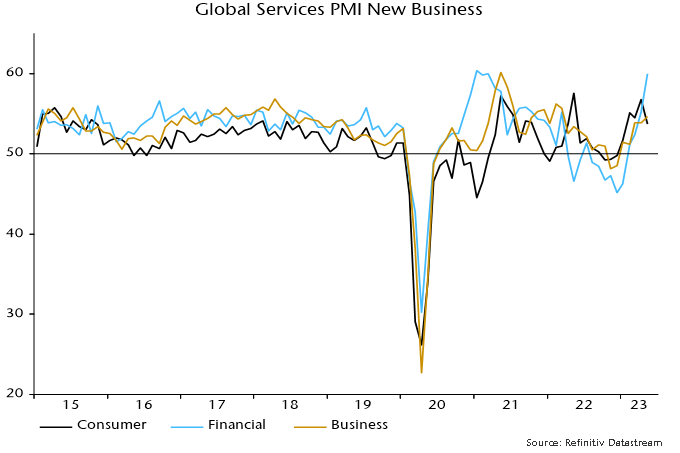
Secondly, the sectoral breakdown of the activity and new business indices shows that May rises were driven by a surge in financial services – chart 3. Consumer services indices eased on the month. Financial services strength is difficult to understand given monetary stagnation, slowing bank lending and flat trading volumes, so may prove short-lived.
Chart 3
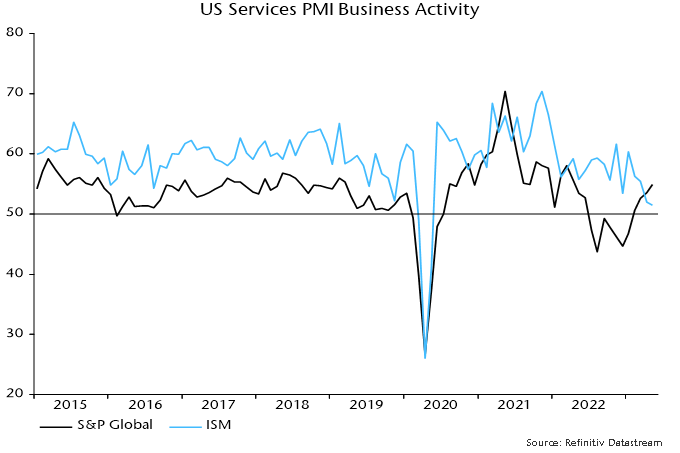
Thirdly, the high May readings of the global activity and new business indices reflect strong contributions from the US and Chinese components but national services surveys are significantly weaker.
The US ISM services activity index fell to a three-year low in May even as the S&P Global equivalent series reached a 13-month high – chart 4.
Chart 4
The Chinese NBS non-manufacturing new orders index moved below 50 in April and fell further in May, in puzzling contrast to the S&P Global / Caixin services new business index, which reached its second-highest level since November 2020.
The global manufacturing new orders and services new business indices have been strongly correlated historically but statistical tests indicate a tendency for manufacturing to lead services rather than vice versa*. With global monetary trends continuing to give a negative economic signal, the current unusually wide gap is more likely to be closed by services weakness than a manufacturing revival.
*In regressions using monthly data with three lags, lagged manufacturing new orders terms are significant in the regression for services new business, but lagged services new business terms are insignificant in the regression for manufacturing new orders.
Global weakness tempered by EM resilience
Monetary trends continue to give a negative message for global economic prospects, suggesting that European / US weakness will outweigh resilience in major EM economies.
G7 plus E7 six-month real narrow money momentum fell again in April, extending a move down from a local peak in December and suggesting a decline in economic momentum through late 2023 – see chart 1.
Chart 1
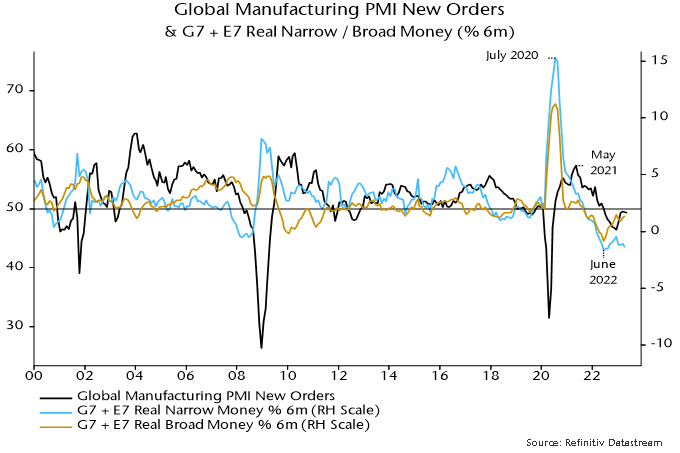
A revival in real narrow money momentum in H2 2022 was reflected in a recovery in global manufacturing PMI new orders between December and March. The recovery stalled in April / May and the forecast here remains for a relapse and possible retest of the December 2022 low during H2 2023.
Narrow money has outperformed broad money as a leading indicator historically, in terms of reliability in signalling turning points in economic momentum. Narrow money usually weakens relative to broad money when interest rates rise as depositors are incentivised to shift funds to less liquid accounts. This is an important feature of the transmission mechanism and one of the reasons narrow money outperforms as a forecasting indicator.
An argument, however, has been made that the unusual speed of the rise in interest rates over the past year, coupled with worries about deposit safety following recent bank failures and an associated switch into money market funds, may have exaggerated narrow money weakness relative to “true” economic prospects. This would suggest giving greater weight to broad money trends at present.
As chart 1 shows, global six-month real broad money momentum recovered more strongly during H2 2002 and has stalled rather than fallen back since December. Still, the message for economic prospects is weak, suggesting no growth revival before 2024.
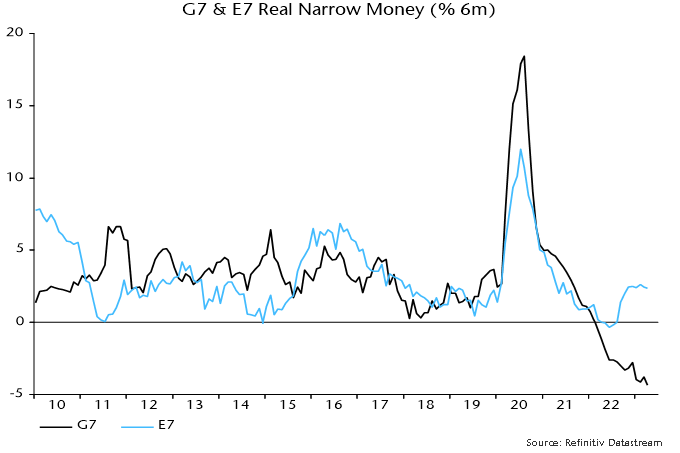
A marginal decline in global manufacturing PMI new orders in May reflected a notable weakening of the DM component offset by stronger EM results. EM resilience is consistent with recent stronger E7 real money momentum (broad as well as narrow) – chart 2.
Chart 2
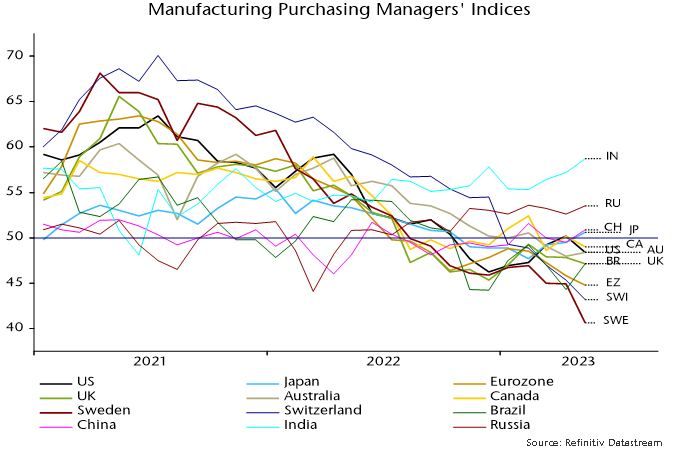
Charts 3 and 4 show six-month real narrow money momentum and manufacturing PMIs in selected major economies. Russia, China and India top the real money momentum ranking with weakness focused on Europe – particularly Switzerland and Sweden. The latest PMI results mirror the real money ranking (rank correlation coefficient = 0.85), with recessionary readings in the Eurozone, Switzerland and Sweden contrasting with Indian / Russian strength.
Chart 3
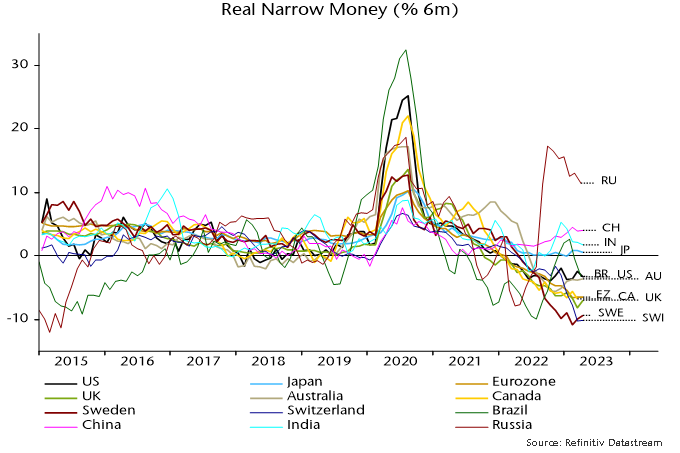
Chart 4