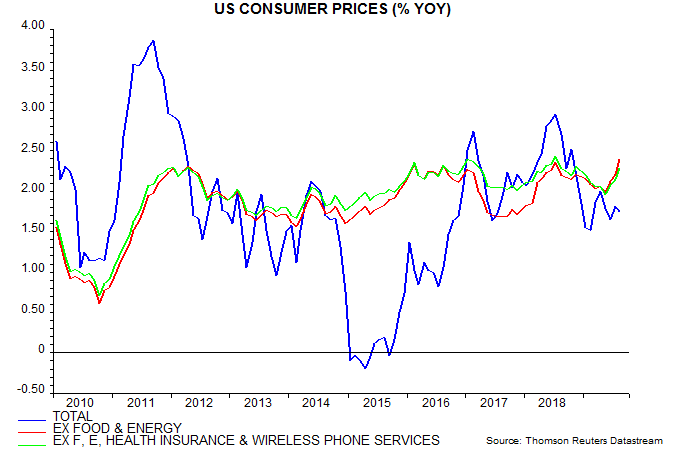
US annual CPI inflation excluding food and energy rose to 2.39% in August, the highest since 2008. Is the pick-up in core inflation long predicted by Phillips curve adherents finally materialising?
A detailed examination suggests not. The ex. food and energy measure has been pushed up by the goods and medical care components – second chart. The goods rise partly reflects tariff effects while the medical care component has been boosted by surging health insurance costs – up by 18.6% in the 12 months to August.
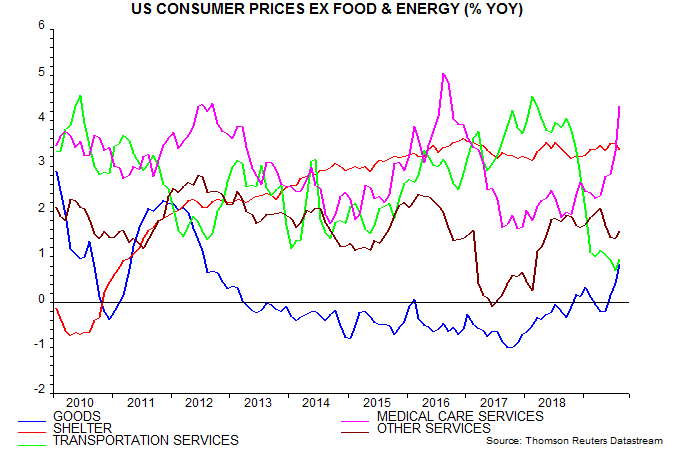
The health insurance component of the CPI is an indirect measure based on insurers’ retained earnings – current strength partly reflects a fall in pay-outs. The equivalent component of the Fed’s favoured price gauge, the personal consumption expenditures index, is much weaker, rising an annual 1.4% in July.
Hikes in tariffs and health insurance costs represent “cost-push” inflation and are demand-deflationary.
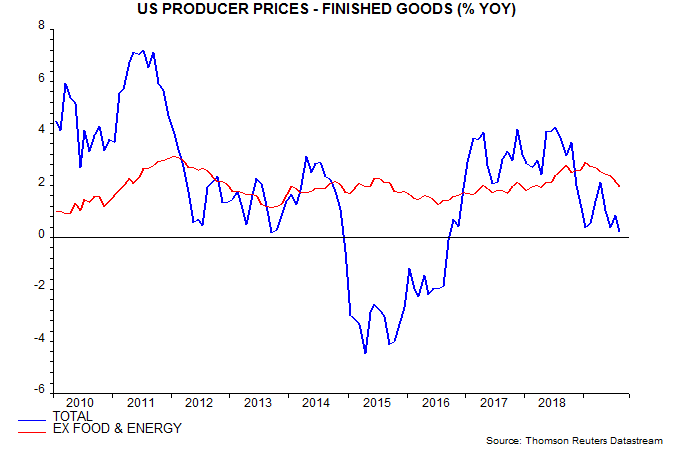
Producer price data signal weakening core goods pressures: annual finished goods inflation ex. food and energy peaked in January and fell further in August – third chart.
The current boost to the CPI from the tiny health insurance component recalls an even larger drag from the similarly-small wireless phone services component in 2017 – their current weights are 1.2% and 1.6% respectively. The fourth chart shows a measure of core CPI inflation excluding both components – this has been significantly less volatile and remains within its recent range.