
A "monetarist" perspective on current equity markets
 Simon Ward
 3 Comments
Global monetary trends have stabilised but remain weak, suggesting slow economic growth and an unpromising backdrop for equities and other risk assets, warranting maintaining a cautious investment stance.
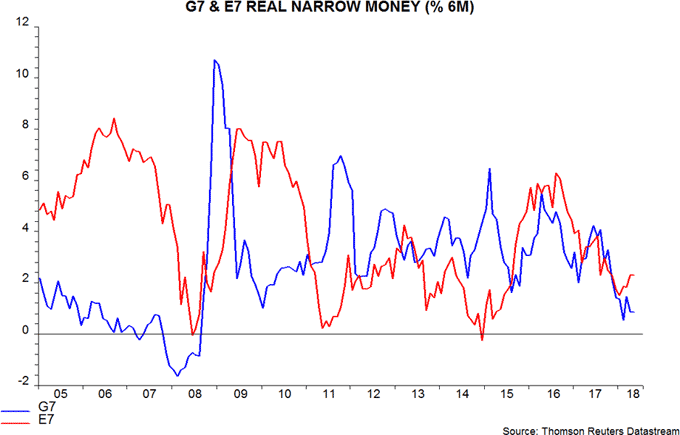
Our key forecasting indicator is the six-month growth rate of real (i.e. inflation-adjusted) narrow money in the G7 countries and seven large emerging economies (the “E7”)*. Real money growth peaked most recently in June 2017, falling to a nine-year low in February 2018. Allowing for the typical nine-month lead, this suggested that global economic growth would peak around March 2018 and fade into the second half of the year.
Shorter-term leading indicators began to confirm the monetary forecast in early 2018. The global manufacturing purchasing managers’ index, for example, peaked in December 2017, falling to an 11-month low in June. A slowdown is now also evident in G7 plus E7 industrial output data, with six-month growth declining sharply in May** – see first chart.
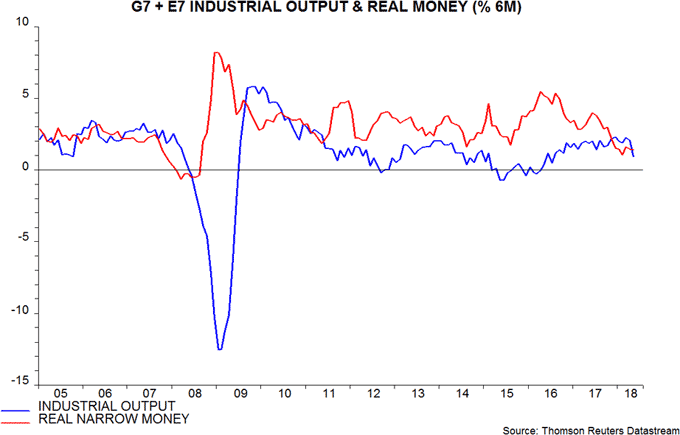
A further significant development in late 2017 was that six-month growth of G7 plus E7 real narrow money crossed beneath industrial output expansion. Since 1970, global equities, as measured by the MSCI World index in US dollar terms, have underperformed US dollar cash by 7.2% per annum on average when real money has lagged industrial output. Equities started the year strongly but MSCI World lost 4.3% between end-January and end-June, resulting in a first-half return of only 0.8%.
Monetary trends, thankfully, stabilised in the second quarter: G7 plus E7 real narrow money growth rebounded in March and held above the February low in April / May. It remains, however, weaker than over 2009-17. The suggestion is that global economic momentum will bottom out in late 2018 but without much of a rebound subsequently. Consensus growth forecasts, in our view, remain too high.
We do not rule out a more significant recovery in real money growth. China has started to ease monetary policy but the impact could be offset by tightening credit market conditions and capital outflows. The US tax cuts may still be filtering through to spending intentions and money demand but any boost may be outweighed by ongoing Fed policy tightening. Escalating trade tensions, meanwhile, may cause a downward revision to business investment plans, a development that would probably be associated with a fall in corporate money growth.
A cautious view of economic and investment prospects, therefore, will be maintained pending more convincing evidence of a change in monetary trends. A monetary relapse, of course, would argue for a further move towards defence.
Our caution is also informed by longer-term cycle analysis, although this plays a secondary role to monetary signals in our forecasting process. Commentators frequently refer to “the” business cycle but there are, in fact, several cycles of different lengths that interact to produce observed economic fluctuations. The three key cycles are the 3-5 year stockbuilding or inventory cycle, the 7-11 year business investment cycle and the 15-25 year housebuilding cycle. Cycle lengths are measured from peak to peak or trough to trough.
The housebuilding cycle bottomed in 2009 so another trough is not scheduled until the mid 2020s at the earliest. The business investment and stockbuilding cycles, however, bottomed most recently in 2009 and 2016 respectively. Downswings in the two cycles, therefore, are scheduled to occur in 2019-20. In the event that the downswings are synchronised, a recession will be likely. The last business investment / stockbuilding recession occurred in 2001. Such recessions are usually – though not always – less severe than those involving downswings in the housebuilding cycle.
The cycle analysis provides a longer-term framework for assessing monetary signals. The current message is that, if global money trends were to recover, the implied subsequent pick-up in economic growth would probably be modest and short-lived. The current position of the business investment and stockbuilding cycles, in other words, argues for downplaying a positive monetary signal while according strong significance to a negative one.
A 2019-20 global recession is not, it should be emphasised, the current central forecast here. Such a scenario would need to be confirmed by the six-month change in global real narrow money turning negative, as it has before every previous recession since the 1970s (at least).
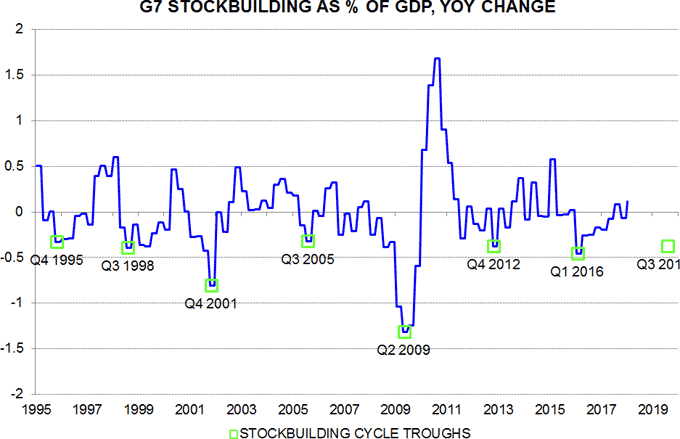
Our analysis suggests that the pattern of market returns is strongly correlated with the stockbuilding cycle, whether or not this cycle is aligned with the other cycles. Specifically, the 18 months following a trough in the stockbuilding cycle is usually a “risk-on” phase characterised by strong performance of equities, credit and commodities, with cyclical sectors outperforming defensives. These trends reverse in the 18-month lead-in to the next trough.
While the stockbuilding cycle can stretch to 5 years, the average historical length has been about 3.5 years. Based on the contribution of stockbuilding to annual G7 GDP growth, we judge that the cycle last bottomed in early 2016, implying that the next trough could occur in the second half of 2019 – second chart. If so, the 18-month negative window for markets may already have opened.
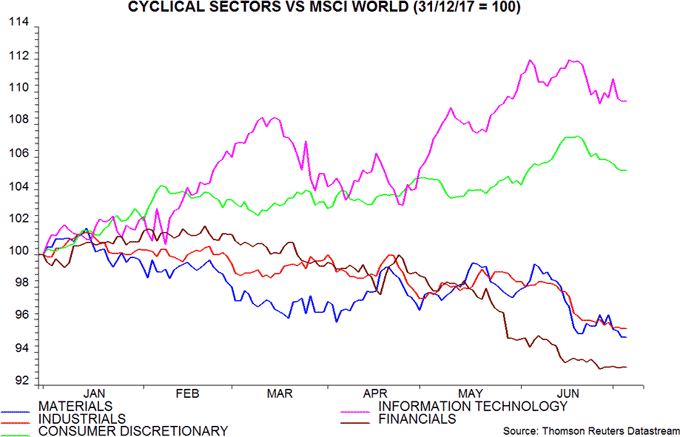
Recent equity market sectoral performance is consistent with an economic slowdown. The MSCI World cyclical sectors index rose strongly in early 2018 but fell by 2.9% between end-February and end-June, versus a 1.9% rise in the defensive sectors index over the same period. The weakness in the cyclical index has been driven by financials, materials and industrials, with information technology and consumer discretionary remaining strong until late in the second quarter – third chart. Energy, utilities and health care have been the best-performing defensive sectors.
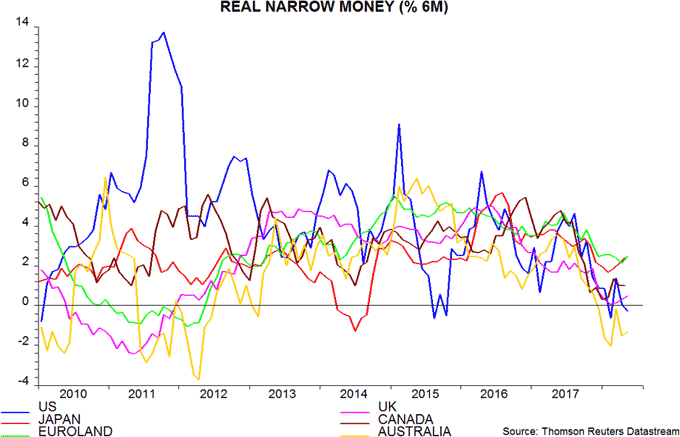
Monetary trends show a similar pattern of stabilisation but no significant recovery across most major developed economies. The six-month rate of change of real narrow money is above-average in Japan and Euroland and weakest in Australia – fourth chart.
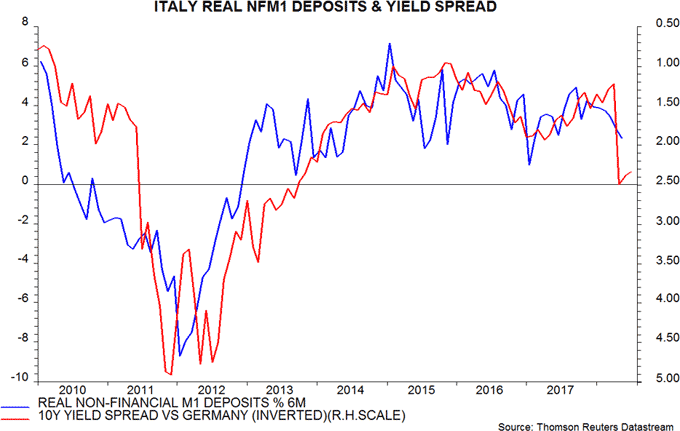
In Euroland, we are on the alert for a further slowdown in Italian real narrow money, reflecting a widening of yield spreads following the formation of an EU-sceptic populist government – fifth chart. The ECB’s plans to phase out bond purchases by end-2018 could act as a drag on area-wide money growth, although the central bank has also signalled that rates will be held at their current negative level through September 2019, at least.
UK monetary trends remain weak and are at risk from a mooted August rate increase. Money measures slowed sharply immediately after the November 2017 hike.
Monetary policy may offer greater support for money trends in Japan, although Bank of Japan bond purchases continue to run well below the expected ¥80 trillion per annum pace. Real money growth has been boosted recently by a slowdown in inflation, although this may prove temporary.
Emerging equity markets typically underperform developed markets during the downswing phase of the stockbuilding cycle. Relative monetary trends, however, are currently supportive, with E7 six-month real narrow money growth slightly above the G7 level – sixth chart. With currency weakness causing policy tightening and higher inflation in a number of EM economies, the sustainability of this positive divergence is in doubt.
*Narrow money = currency in circulation plus demand deposits and close substitutes. Broad money = narrow money plus time deposits, notice accounts, repos and bank securities. Precise definitions vary by country. Narrow money has been more reliable than broad money for forecasting purposes historically and is consequently emphasised in the analysis here. E7 defined here as Brazil, Russia, India, China, Korea, Mexico and Taiwan.
**The May fall was exaggerated by a fire at a US auto parts plant and a truckers’ strike in Brazil.
 View Printer Friendly Version
 Email Article to Friend
Reader Comments (3)
Fully expecting Chinese monetary trends to continue to deteriorate.The Chinese to discover that their extrapolated trend growth rates are as fanciful as those in the West pre 2008/9.
Kyle Bass will finally be proved right about China; the consequences will be highly unpredictable. Likely there will be a significant spill over in to Western economies. Hussman will also finally have his day, again.
Global asset bubbles created by ZIRP, which have culminated in the Crypto bubble will deflate spectacularly.
Sir Mervyn will be proved correct about the Global Imbalances he warned of in 2011.
Rather than making any effort to understand what happened in 2008/9 the world carried on as before because it was politically palatable to do so.
Very interesting thank you - I follow this blog regularly.
I wondered if you comment on the collapse of the measure of money velocity; despite QE this has been collapsing since the GFC. Is this measure still of note, and what impact could QT have on this measure, and therefore the economy?
Sorry for the late reply to your comment. Narrow money velocity has declined more quickly since the GFC but broad money velocity has fallen at a similar or slower pace. The faster decline of narrow money velocity, in my opinion, reflects the low level of interest rates and yields on financial assets generally, which has reduced the opportunity cost of holding the most liquid forms of money. QE may have contributed to this by depressing rates / yields. If these now rise, perhaps partly because of QT, the decline in velocity is likely to slow or even reverse. Such a change of trend may be occurring in the US, where M1 / M2 velocity has risen this year.