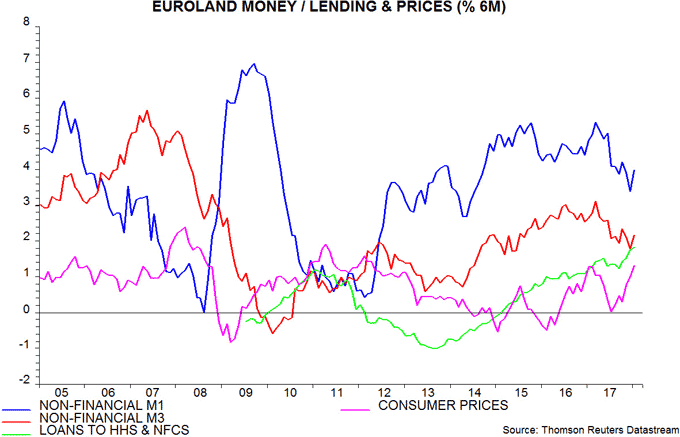
Euroland monetary growth recovered modestly in January but a slowdown since mid-2017 continues to suggest a loss of economic momentum through late 2018. The OECD’s Euroland leading index is confirming a prospective downshift in economic growth.
As usual, the monetary analysis here focuses on non-financial M1 / M3, the forecasting performance of which is superior to the headline M1 / M3 measures*.
Non-financial M1 rose by a solid 1.1% between December and January, with non-financial M3 up by 0.6%. Six-month growth of the two aggregates reversed a decline in December but remains lower than during the first half of 2017 – see first chart.

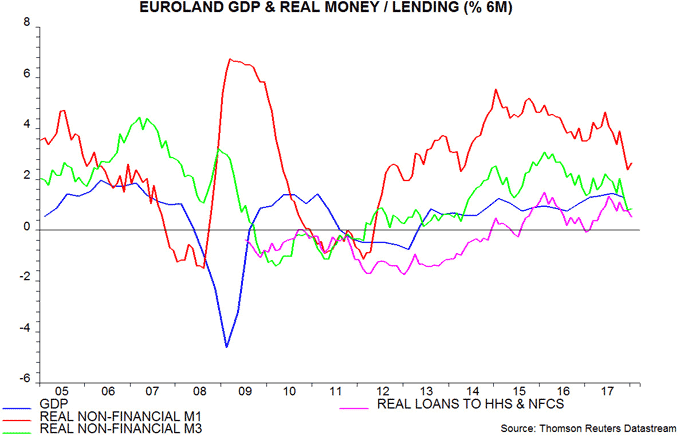
The recovery in six-month nominal growth, moreover, was roughly matched by a further rise in six-month consumer price inflation, so real money expansion was little changed, having reached its lowest since 2014 in December – second chart.

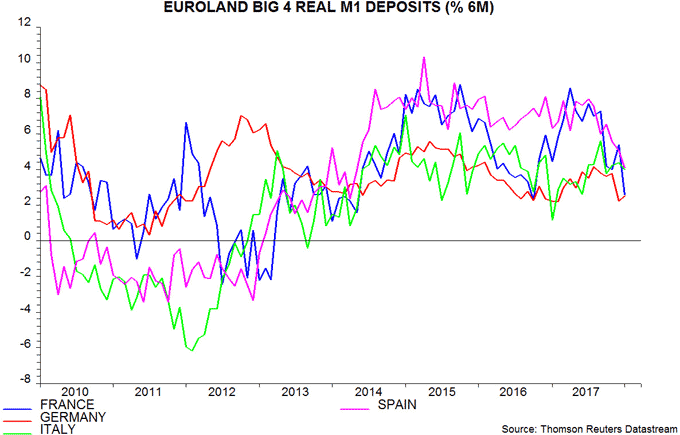
The ECB publishes a country breakdown of overnight deposits, which account for more than 80% of M1. This breakdown suggests that the slowdown in Euroland real narrow money since mid-2017 has been driven by France and Spain – third chart. Better French economic data since the election of President Macron may have been coincidental and temporary, while the Catalonia political crisis may be dragging on Spanish prospects.

German real overnight deposit growth has fallen by less but from a lower level. Strong German GDP growth during the second half of 2017 relied on net exports – domestic demand rose by only 0.25% per quarter. Italian real deposit growth has been relatively stable recently.
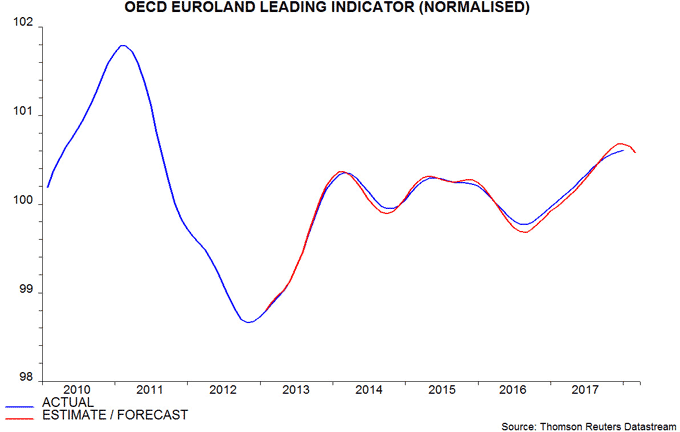
The OECD’s Euroland composite leading index, which typically lags monetary trends by several months (and excludes money measures), confirms softer economic prospects. The normalised version of the index is estimated to have declined in January, the first fall since August 2016, with a further reduction projected for February – fourth chart**. The normalised index is designed to predict GDP relative to trend, so the shift from rising to stable / falling suggests that recent strong growth will give way to trend or slightly below-trend expansion.

The turnaround in the index mainly reflects a recent cooling of business and consumer surveys, along with weaker stock market performance.
*Non-financial = covering holdings of households (HHs) and non-financial corporations (NFCs), i.e. excluding financial sector money.
**The OECD is scheduled to release a January reading on 8 March but most of the component information is available, allowing an independent calculation.