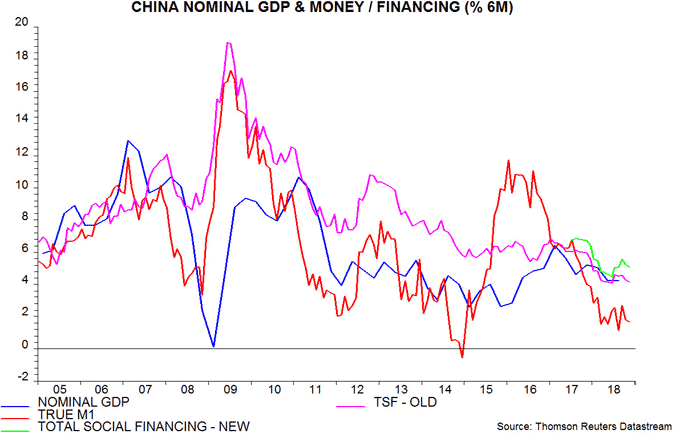
Chinese November money and credit numbers were disappointing for economic optimists, suggesting that policy easing is still failing to gain traction.
Six-month growth of true M1, the preferred narrow money measure here, was little changed in November and close to the recent low reached in August – see first chart*.

Six-month growth of total social financing, on the new definition including local government special bonds, similarly showed no improvement. The recovery from a low in June solely reflects heavy issuance of such bonds over July-September. On the former definition, six-month expansion in November almost matched the recent low.
Year-on-year growth of all three measures reached new lows in November – second chart.

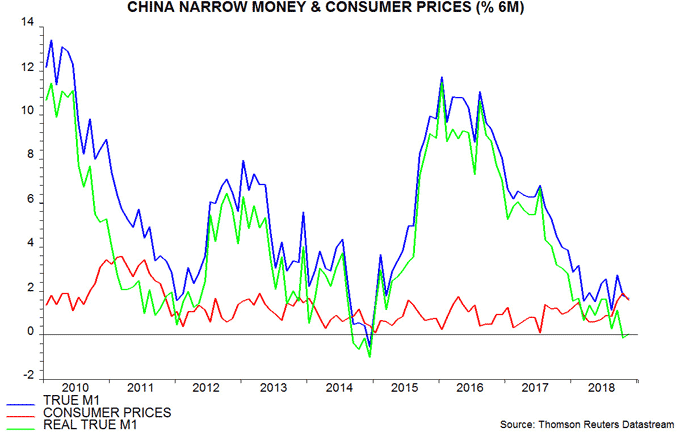
As expected, real money and credit growth in November was supported by a fall in consumer price inflation, reflecting declines in fuel and food prices. The six-month change in real true M1, however, remained close to zero – third chart.

Sectoral figures show that year-on-year growth of bank deposits of non-financial enterprises fell further in November and is now lower than before the 2015-16 economic slowdown / hard landing scare. Weakness is consistent with recent profits deceleration and signals deteriorating prospects for business investment – fourth chart.

The year-on-year fall in interest rates suggests a coming recovery in money trends – fifth chart – but this may be delayed and / or weakened by the ongoing clampdown on shadow banking activity. The authorities may need to offer banks additional incentives to lend to private sector firms to offset the contraction of shadow activity. Current money data signal a further loss of economic momentum in early 2019, with any reacceleration unlikely until the second half at the earliest.

*True M1 = currency in circulation + demand deposits of enterprises, government organisations and households. The official M1 measure excludes household deposits. The November data point in the chart is an estimate and assumes a 1% monthly rise in household demand deposits.