A "monetarist" perspective on current equity markets
“Goldilocks” is over. The economic backdrop for markets has been unusually favourable in recent years, with growth mostly solid but not strong enough to produce capacity strains, allowing monetary conditions to remain loose. Now, growth has gone cold but hot labour markets are pushing up wage costs, squeezing profits and causing central banks to turn more hawkish.
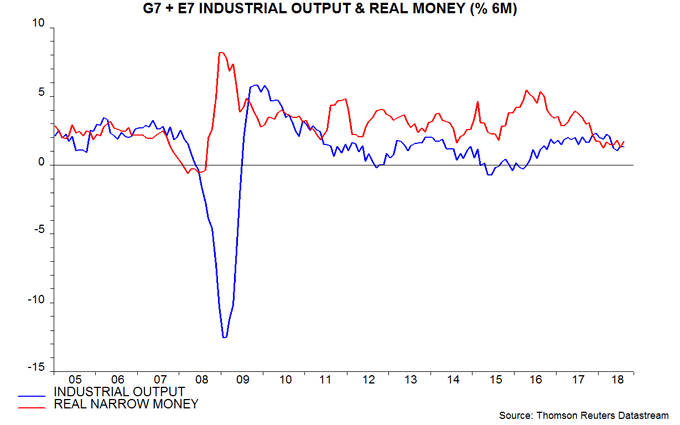
Previous quarterly commentaries suggested that the global economy would lose momentum progressively during 2018. This forecast is on track: six-month growth of industrial output in the G7 economies and seven large emerging economies* peaked in December 2017 and fell sharply over April-June 2018, with no significant recovery in July-August – see first chart. Business surveys suggest a near-term further slowdown: the global manufacturing purchasing managers’ index (PMI) fell for a fifth consecutive month in September, reaching a 22-month low.
The key forecasting indicator followed here – six-month growth of G7 plus E7 real (i.e. inflation-adjusted) narrow money** – bottomed in February 2018 and has moved sideways through August. Allowing for a typical nine-month lead, the suggestion is that industrial output growth will reach a low around November, stabilising at a weak level into early 2019. If correct, the manufacturing PMI may bottom out soon while remaining soft by recent historical standards.
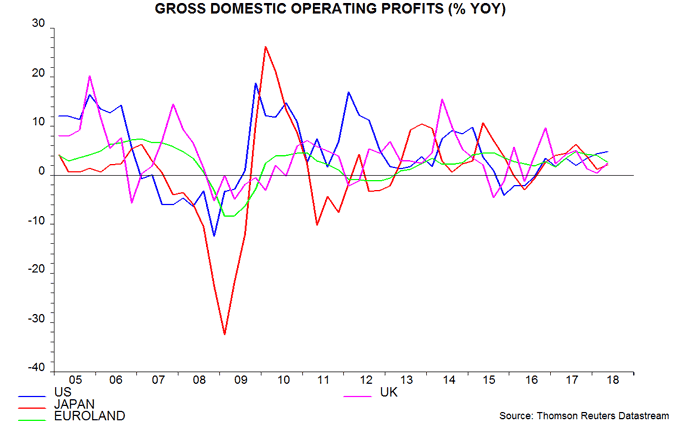
The suggested scenario of below-trend but stabilising economic growth would imply some easing of labour market pressures but would be unlikely to result in sufficient slack to reverse wage acceleration – unemployment rates are below estimated non-inflationary levels in most major economies. Recent stronger wage growth reflects worker demands for compensation for higher inflation as well as labour shortages. Faster growth of wage bills has contributed to a slowdown in profits in Japan, Euroland and the UK, a trend that may extend to the US during the second half – second chart.
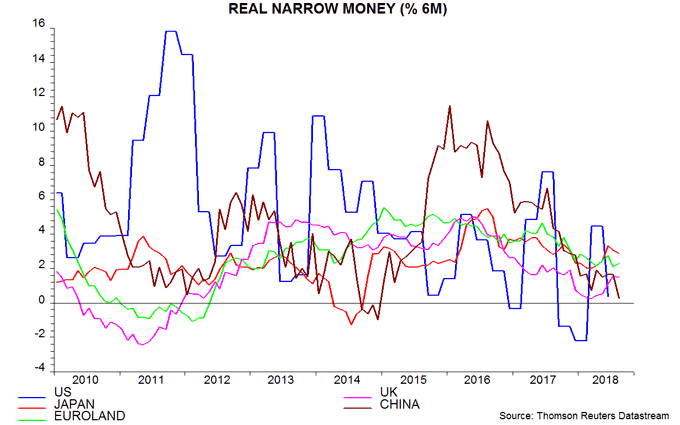
There have been three notable monetary developments since our last commentary. First, growth in our preferred US money measure, real non-financial M1***, fell sharply in the second quarter, signalling a likely loss of economic momentum in late 2018 / early 2019 – third chart. Business money holdings, surprisingly, have contracted despite tax cuts and repatriation of foreign retained earnings, with corporations choosing to step up equity purchases and lower borrowing rather than boost their liquid reserves.
Secondly, Chinese money trends continued to weaken through August despite a recent shift towards policy easing. This could reflect a normal response lag; alternatively, easing to date may have been insufficient, with the authorities maintaining their clampdown on shadow credit. Other leading indicators, meanwhile, are now confirming the negative message from money trends, suggesting heightened downside economic risk.
Thirdly, real money growth has stabilised in Euroland and recovered modestly in the UK, therefore improving compared with US / Chinese trends. Our inclination, however, towards greater optimism about European economic / equity market prospects is tempered by coming challenges – the withdrawal of QE support for weaker sovereign bond markets and a brewing Italy / EU fiscal clash in the case of Euroland, and possible further Brexit turmoil in the UK. The UK monetary recovery, moreover, could be aborted by the August rate hike.
Global economic prospects for later in 2019 will depend on monetary developments over the remainder of 2018. The forecasting approach here does not attempt to predict monetary trends but further weakness seems more likely than renewed strength. Fed policy tightening is being transmitted globally via the strong US dollar: central banks in 12 out of 32 developed and emerging markets raised official rates during the third quarter, while none cut. Recent oil price gains, meanwhile, could result in a larger inflation drag on real money trends.
Chinese money growth should be supported by policy easing but a 2015-style surge is unlikely, given official reluctance to reopen the credit floodgates. Reserve injections, moreover, could boost capital outflows, increasing downward pressure on the currency and limiting the authorities’ room for manoeuvre. China was rescued from this dilemma in 2016 by the Yellen Fed putting its rate-hike campaign on hold for a full year, relieving upward pressure on the dollar; the Powell Fed, judging from recent communications, is unlikely to be so accommodating.
The current monetary backdrop, in our view, warrants a cautious stance towards equity markets. Previous commentaries discussed two rules for switching between equities and cash based on monetary indicators. The first rule moves into cash if G7 plus E7 six-month real narrow money growth crosses beneath industrial output growth; the second does so if G7-only annual real narrow money growth falls below its long-run average of 3%. Both rules would have outperformed buy-and-hold significantly and both were in cash at end-September.
The first rule is likely to switch back into equities at end-October, based on available August monetary and output data, with the second rule remaining in cash. Historically, average equity returns have been below the long-term mean when the rules have given different signals, and significantly negative when they have both favoured cash.
A cautious view of economic and market prospects is also suggested by cycle analysis, which we use to provide longer-term context for monetary signals. There are three key economic cycles: the 3-5 year stockbuilding cycle, the 7-11 year business investment cycle and the 15-25 year housing cycle. Shorter cycles “nest” within longer ones, in the sense that troughs tend to coincide. All three cycles hit bottom in 2009, explaining the severity of the 2008-09 recession.
Downswings in the stockbuilding cycle in 2011-12 and 2015-16 were associated with extended “soft patches” in the post-crisis economic upswing. Based on its average historical length of about 3.5 years, another stockbuilding cycle trough could occur in 2019, while the business investment cycle is scheduled to bottom by 2020 at the latest. The cycle analysis, therefore, suggests preparing for further economic weakness in 2019-20.
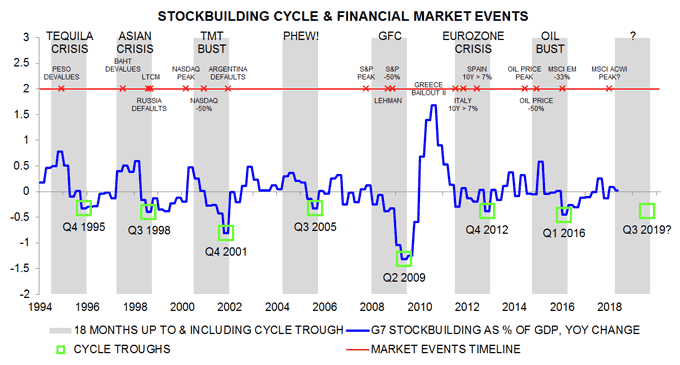
The stockbuilding cycle appears to be an important influence on financial market trends. Risk assets tend to weaken in the 18 months leading up to a cycle trough and rebound strongly in the first 18 months of the upswing. The fourth chart shows our suggested dating of cycle troughs and the implied 18-month “risk-off” periods for markets (shaded). Six of the last seven such periods were associated with a crisis and / or major bear market in one or more assets.
Based on our judgement that the last trough occurred in the first quarter of 2016, and assuming that the current cycle is of average length, the next low could occur in the third quarter of 2019. This would imply that another 18-month negative period for markets started in early 2018.
The table compares the performance of different assets since end-February 2018 with averages calculated over the previous seven 18-month negative periods. The pattern of returns is consistent with the assumption that markets entered a negative phase in early 2018, with overall equity market performance lacklustre, US stocks outperforming, cyclical sectors and emerging markets underperforming, the US dollar strengthening and a basket of commodity prices weakening.
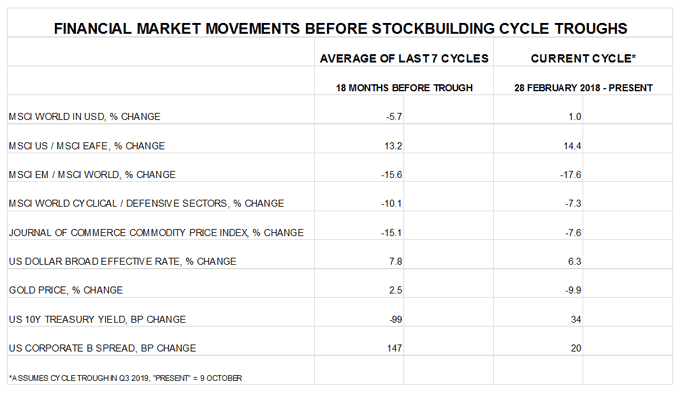
If the current cycle returns were to conform to the historical averages, and assuming that our dating of the cycle is correct, equity markets would weaken by the third quarter of 2019, with cyclical sectors underperforming further. US and emerging market stocks, however, would stop outperforming / underperforming, the US dollar would be little changed, while the recent rise in US Treasury yields would reverse and corporate credit spreads would increase significantly.
*Brazil, Russia, India, China, Korea, Mexico and Taiwan.
**Narrow money = currency in circulation plus demand deposits and close substitutes. Broad money = narrow money plus time deposits, notice accounts, repos and bank securities. Precise definitions vary by country. Narrow money has been more reliable than broad money for forecasting purposes historically and is consequently emphasised in the analysis here.
***Non-financial = held by households and non-financial businesses.

Reader Comments (1)
Just to say publicly a very hearty "Well Done" to you, Simon!
Your equity market caution, based on your two liquidity models and cyclical analysis has been highly accurate.
The highest quality work and attention to timing implications.
Thank you again for this ongoing journal commentary which enables mere individuals to keep up with your insight!
Tony B