Euroland monetary trends cooling
Euroland July money numbers were weak, suggesting that economic prospects are deteriorating at the margin.
Non-financial M1 – the monetary measure with the strongest historical forecasting record, according to ECB research – was unchanged in July from June, while the broader non-financial M3 aggregate fell by 0.1%*.
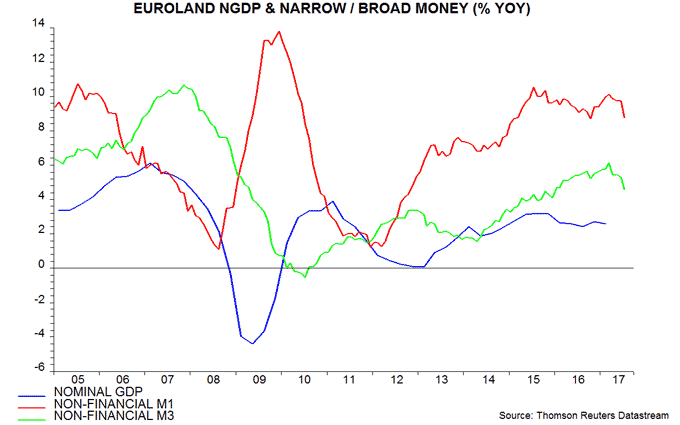
Annual non-financial M1 growth of 8.8% in July was the lowest since October 2016; non-financial M3 growth of 4.6% was the lowest since December 2015 – see first chart.

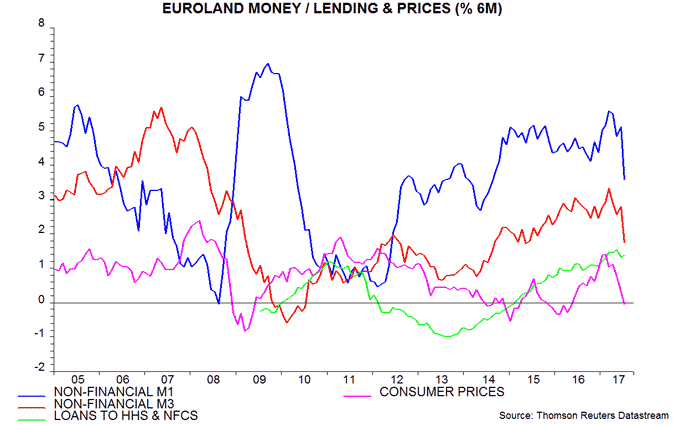
Six-month growth of the two aggregates has plunged since March: the declines between March and July were the largest over a four-month period since 2010 – second chart.

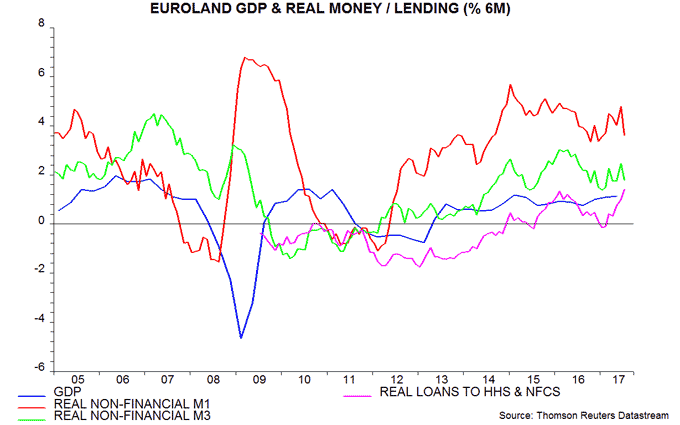
The impact on six-month real money expansion has been cushioned by a parallel sharp slowdown in headline consumer prices, reflecting the unwinding of a boost from energy and food prices in late 2016 / early 2017 – second and third charts. Real money growth, however, has pulled back sufficiently to suggest a slowing of economic momentum in late 2017 / early 2018. Six-month inflation, moreover, is likely to rebound, so real money trends may weaken further.

The headline M1 and M3 measures have slowed by less than the non-financial aggregates tracked here, reflecting relative strength in money holdings of financial corporations. Such holdings, however, are of little relevance for judging near-term prospects for spending on goods and services.
Six-month real narrow money growth was higher in Euroland than the US in late 2016, signalling superior Euroland economic prospects. The gap closed in May and the US was back ahead in July – fourth chart.

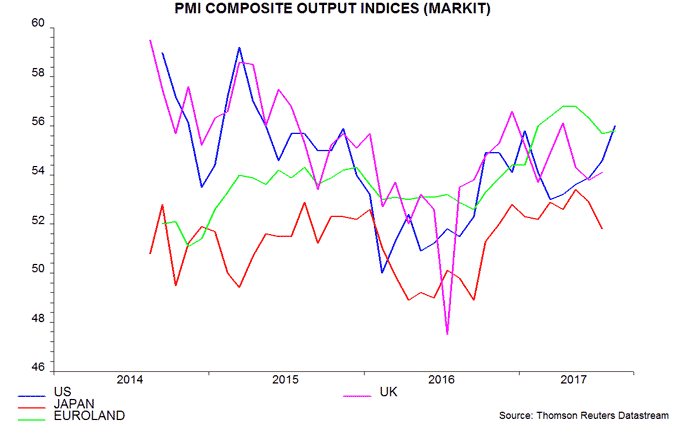
August PMIs are consistent with the forecast that the US will resume growth leadership: the US composite output index rose to its highest since May 2015, overtaking the Euroland index – fifth chart.

*Non-financial = held by households and non-financial corporations.

Reader Comments