Global economic growth remained robust in early 2017 but monetary trends and leading indicators suggest that strength will fade from the spring. Central banks may continue to withdraw policy stimulus despite slower economic momentum because of late-cycle inflationary pressures. Lower real money growth implies a less favourable liquidity backdrop for markets, while earnings may fall short of expectations as the global economy cools.
On our calculations, GDP in the G7 major economies and seven large emerging economies (the “E7”) rose at a 2.8% annualised pace in the fourth quarter of 2016 after a 3.2% third-quarter gain. Average growth of 3.0% over the second half was the fastest since the second half of 2014. Business surveys signal continued strength in early 2017: J P Morgan’s global all-industry purchasing managers’ output index rose further between the fourth and first quarters.
Global economic acceleration was predicted by monetary trends. Our key global forecasting indicator is the six-month growth rate of real (i.e. inflation-adjusted) narrow money in the G7 plus E7 economies. Narrow money comprises currency in circulation and demand deposits – forms of money most closely related to economic transactions. Turning points in this indicator have consistently led turning points in G7 plus E7 industrial output growth over the past 50+ years, typically by between six and 12 months.
Real narrow money growth peaked in August 2016 at its fastest pace since 2009, suggesting that economic momentum would rise into spring 2017, allowing for an average nine-month lead. The subsequent monetary slowdown was exaggerated by India’s “demonetisation” programme, which resulted in narrow money M1 plunging by 30% between October and December. We have attempted to adjust for this distortion by recalculating our real money growth measure holding Indian M1 stable at its pre-demonetisation level. The adjusted measure fell sharply in late 2016 / early 2017, reaching an 18-month low in February – see first chart. Four-fifths of the decline in the measure since August 2016 has reflected weaker nominal narrow money expansion, with the remaining one-fifth due to higher inflation.
Our forecasting process seeks confirmation of monetary signals from a non-monetary composite leading indicator for the G7 plus E7 economies, derived from OECD country leading indicator data. This indicator combines a wide range of economic and financial series that have led activity fluctuations historically. Its average lead time at turning points is shorter than for real narrow money – typically four to five months. Six-month growth of the indicator plateaued in February, while one-month growth fell for a second month – second chart. This behaviour is consistent with the suggested scenario of global economic momentum slowing from a spring peak.
Real narrow money growth has fallen by varying amounts across the major economies. Weakness has been most pronounced in the US, suggesting that GDP expansion will fall short of Federal Reserve and consensus expectations – third chart. The UK has also slowed sharply recently. Growth, by contrast, is holding up in Euroland and Japan, and remains high in China. Brazil and Russia are bucking the trend, with real money growth reviving as inflation falls and policy eases.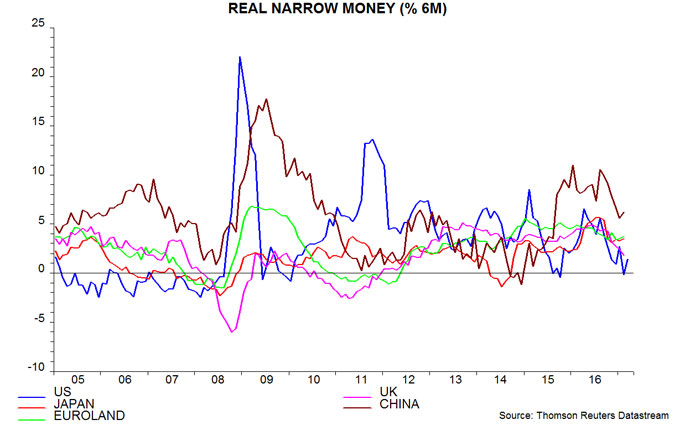
With monetary trends giving mixed signals across countries, our base-case scenario is for a moderate global economic slowdown rather than significant weakness. This would be consistent with our economic cycle analysis, which suggests that the US / global stockbuilding and business investment cycles will remain in upswings through 2017. Such a scenario, however, requires our global adjusted real narrow money growth measure to stabilise or recover from its current position near the bottom of its post-crisis range – first chart.
Early- or mid-cycle economic slowdowns usually generate a swift central bank response and are associated with falling government bond yields and commodity price weakness. Late-cycle slowdowns, by contrast, are often accompanied by a rise in inflation due to tight labour markets, capacity constraints and productivity slippage, delaying policy relief and yield declines. The G7 unemployment rate is lower than at the peaks of the last two economic cycles – fourth chart. Upward pressure on wage growth and core inflation may keep central banks on a tightening tack despite softer economic data, with negative implications for equities.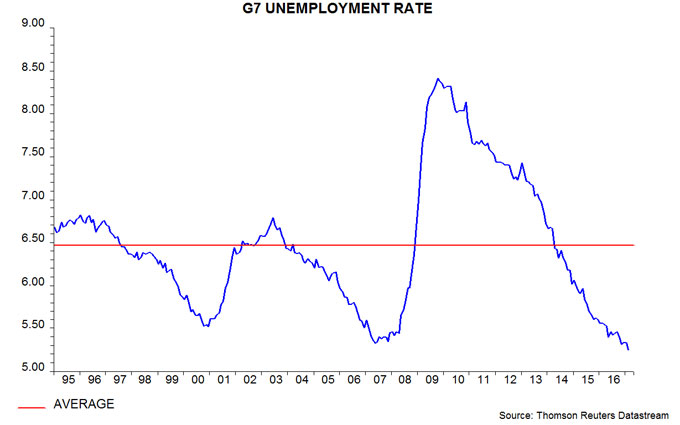
Our analysis of data since 1970 indicates that major equity market declines have usually been preceded by one or more of the following conditions: 1) G7 annual real narrow money growth falling below 3%; 2) real money growth falling below industrial output expansion; 3) real money growth falling by 3 percentage points or more within six months. Conditions 1) and 2) are unlikely to be triggered soon but real money growth has declined from a peak of 8.6% in October 2016 to 6.5% in February; a further fall to 5.5% or lower by April, therefore, would meet condition 3) and warrant shifting to a defensive investment stance.
Relative real narrow money trends argue for overweighting emerging versus developed markets, and EAFE markets versus the US. E7 real money growth, adjusted for India’s demonetisation, remains above the G7 level, a condition associated with emerging markets outperforming on average historically – fifth chart. A sustained shortfall of US real money growth relative to other developed economies, meanwhile, would be reminiscent of the mid 2000s, when EAFE stocks outpaced the US market, partly reflecting a weakening US dollar.
Our previous quarterly commentary questioned consensus bullishness on the dollar on the grounds that a record capital outflow from Euroland, Japan and China had boosted the US currency in 2016 but was likely to slow in 2017. Recent data are consistent with this hypothesis and the reversal in capital flows may extend if US economic growth weakens relative to the rest of the world, as suggested by monetary trends. A recovery in the renminbi is possible in response to a rise in Chinese / US interest rate differentials in the first quarter and as Chinese policy shifts towards promoting a firmer exchange rate to defuse trade tensions with the US administration.