The OECD’s leading indicators are giving tentative confirmation of the forecast here, based on real narrow money trends, that global economic momentum will peak in spring 2017 and slow into the autumn.
The OECD this week released January data for its country leading indicators. Note that the January estimates of the trends in the components incorporate February data where available – so the indicators already reflect strong February business survey results, for example. The country information is combined and transformed here to create a global (i.e. G7 plus E7) leading indicator of industrial output. Six-month growth of this indicator continued to rise in January but the one-month increase fell back – see first chart.
As previously discussed, global six-month real narrow money growth peaked in August 2016, suggesting a peak in industrial output expansion around May 2017, allowing for an average nine-month lead. Six-month growth of the leading indicator may have peaked in January, based on the fall in one-month momentum. It typically leads by four to five months, so this would suggest a peak in economic momentum in May-June, consistent with the monetary signal.
The prospect of a summer economic slowdown, coupled with the Fed’s recent hawkish shift, may imply stronger headwinds for equity markets and other risk assets. Any setback, however, could prove to be modest and temporary if investors believe that the economy will retain reasonable momentum and / or reaccelerate in late 2017.
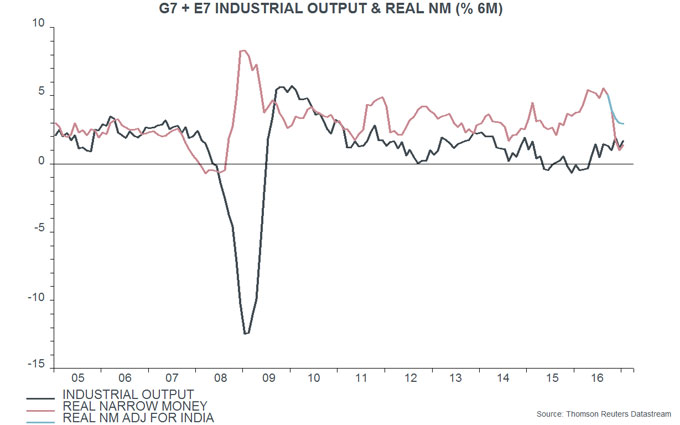
Such a scenario cannot be ruled out based on current monetary data. Global six-month real narrow money growth, while well down from last summer, remains at a respectable level by historical standards, after adjusting for an excessively negative signal from Indian M1 due to the demonetisation programme – second chart. The recent fall has partly reflected a sharp rise in six-month consumer price inflation, which is likely to moderate if commodity prices stabilise at their current level. In the US, February narrow money numbers may have been depressed by a delayed send-out of income tax refunds, reflecting legal changes: refunds last month were $25 billion lower than in February 2016, equivalent to 0.9% of the narrow money stock measure tracked here – third chart.