
Global money trends signalling economic growth peak
 Simon Ward
 Post a Comment
The consensus view is that 2018 will be another year of strong and broadly-based global economic growth. Monetary trends and cycle analysis, by contrast, suggest that early robust momentum will fade as the year progresses.
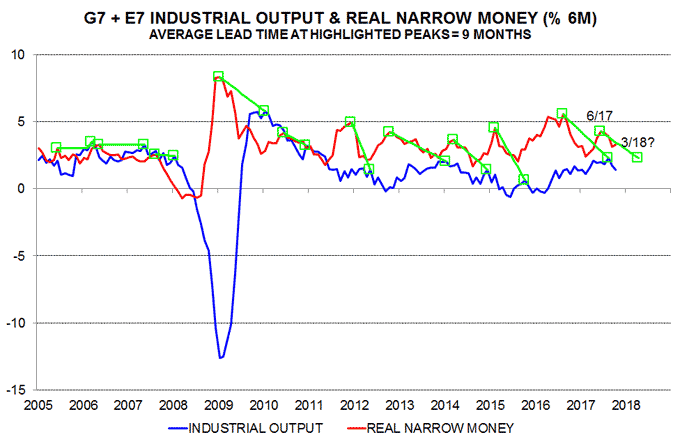
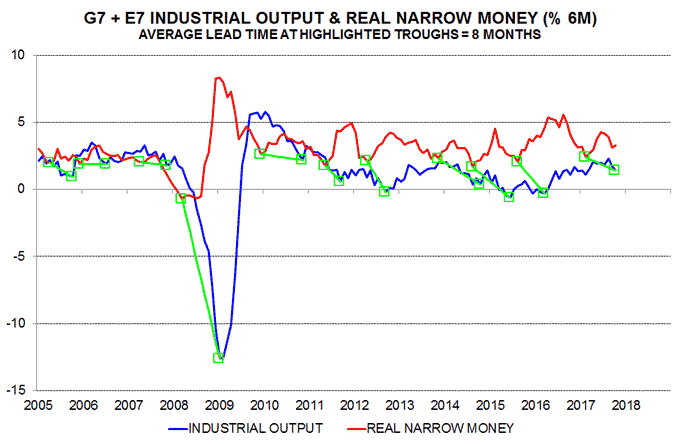
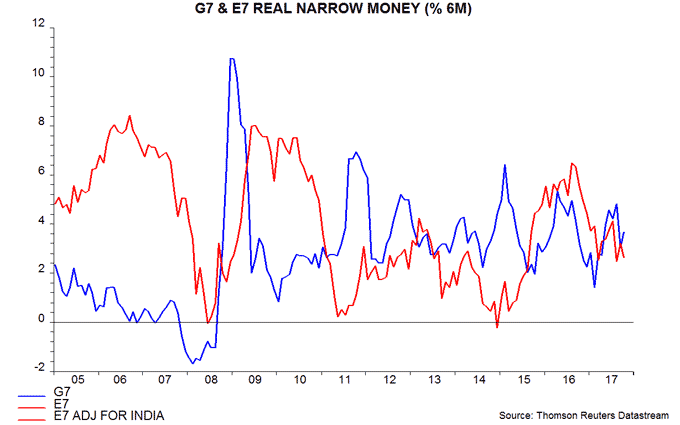
As indicated by earlier partial data, global (i.e. G7 plus emerging E7) six-month real narrow money growth edged up in October after falling between June and September. Real money momentum turning points have led turning points in industrial output momentum by an average of nine months since 2005 – see first and second charts*. The June peak, therefore, suggests that six-month industrial output growth, which has moderated since the summer, will reach another peak around March 2018.
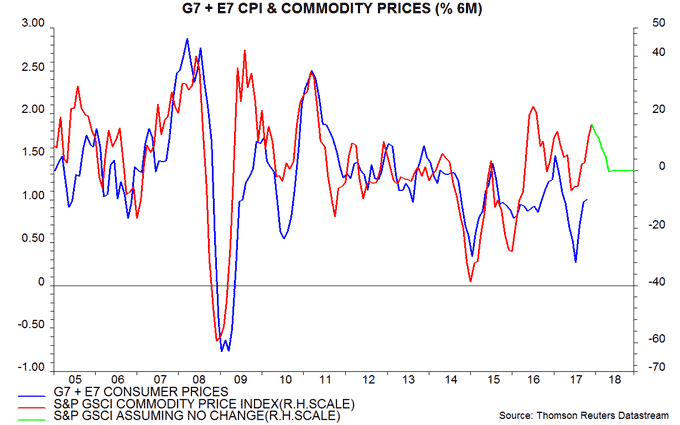
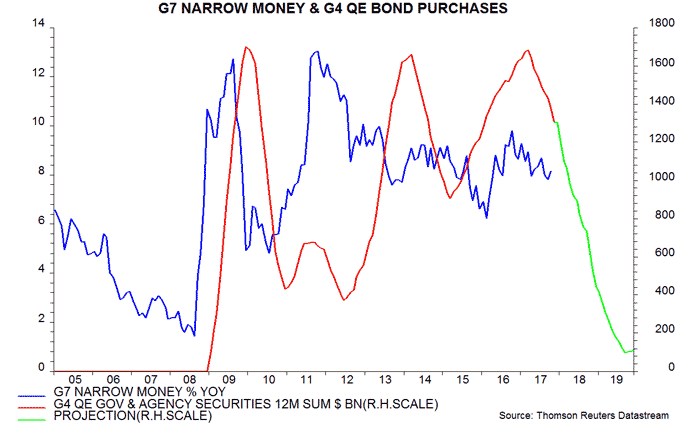
With global real narrow money growth still respectable in October, a post-March economic slowdown may initially be modest. Recent commodity price gains, however, may push up six-month consumer price inflation further, implying an increased drag on real money growth assuming stable nominal expansion – third chart. Nominal narrow money trends, meanwhile, could weaken if slowing QE leads to a reduction in risk appetite and broad money velocity – fourth chart.
The suggestion that economic momentum will peak by the end of the first quarter is consistent with the assessment here that the US / global stockbuilding cycle is approaching the end of its upswing phase. The cycle has an average duration of 13-14 quarters and probably bottomed in early 2016 – see previous post.
Upward pressure on unit labour cost growth and core inflation may be sustained well beyond an economic growth peak, reflecting stretched labour markets. The G7 unemployment rate fell further in October and is well below major lows reached in the 1990, 2000 and 2007 – fifth chart.

Headline inflation prospects may depend partly on Chinese policy developments. Narrow money trends are signalling a slowdown in house prices, industrial profits and producer prices into early 2018 – see previous post. The authorities may respond by partially reversing monetary and regulatory policy tightening in 2017, in which case global commodity prices may strengthen further despite peaking economic growth, with such strength sustaining upward pressure on G7 headline inflation and policy rates.
Put differently, Chinese policy tightening may have relieved pressure on G7 central banks in 2017; the reverse may be true in 2018.
The recent fall in global six-month real narrow money growth reflects declines in both the G7 and E7 but the G7 / E7 gap remains slightly positive, casting doubt on recommendations to be overweight emerging market equities – sixth chart.
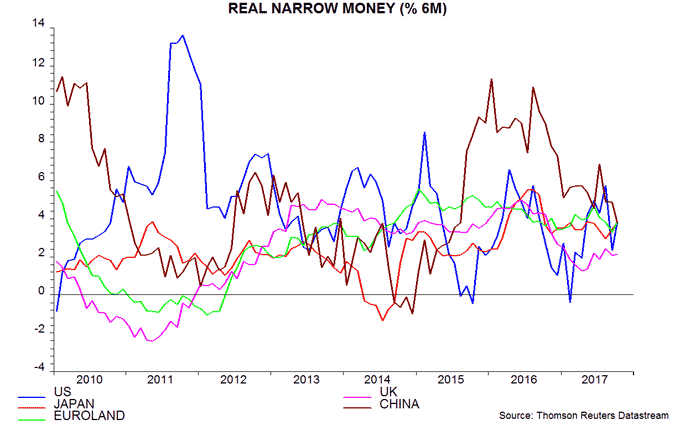
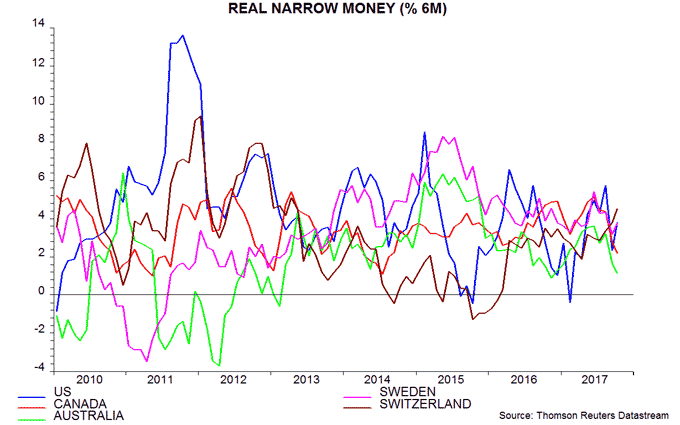
The range of variation in six-month real narrow money growth across the major economies is unusually small: October growth was equal in the US, Japan, Euroland and China, with the UK only modestly lower – seventh chart. Among other developed economies, real money growth has weakened in Australia and to a lesser extent Canada but is strong in Switzerland – eighth chart.
*The series shown incorporate adjustments to exclude temporary large falls in Japanese industrial output in 2011 and Indian narrow money M1 in 2016 due respectively to the March 2011 Tohoku earthquake / tsunami and the November 2016 demonetisation programme. An average lead of nine months was also found in a longer-term (50 year) study of G7-only data.
 View Printer Friendly Version
 Email Article to Friend
Reader Comments