
China data summary: more positives than negatives
 Simon Ward
 Post a Comment
Chinese activity and money / credit data for July were mixed but are interpreted here as supporting a positive view of near-term prospects.
Annual industrial output growth edged lower in July but the six-month rate of increase rose to its strongest level since 2014, based on the World Bank’s seasonally-adjusted level series – see first chart. A rebound in steel output has contributed to the recent pick-up and may be a positive signal for prospects – steel output is a component of the OECD’s Chinese leading indicator.
The rise in six-month industrial output growth accords with the Markit / Caixin manufacturing purchasing managers’ index, which moved above the 50 level last month for the first time since February 2015.
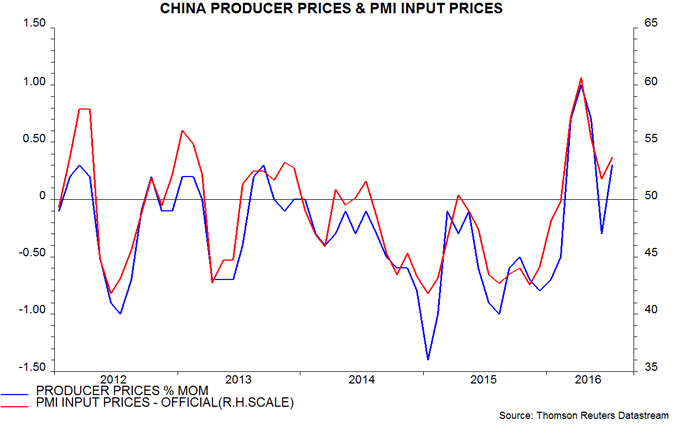
Pessimistic commentary has focused on a further slowdown in fixed asset investment, with the private sector component contracting in the year to July – second chart. The working assumption here is that private investment has been adjusting to lower economic growth and a fall in profits in 2014-15. With profits now recovering, and non-financial enterprise deposits rising strongly, a turnaround may be imminent – third chart. The profits rebound partly reflects an easing of deflationary pressures, with producer prices rising in four of the last five months – fourth chart.
Annual growth in housing sales and starts peaked in March but has remained positive, recovering slightly in July – fifth chart.
Exports could provide a fillip during the second half. The average level of the renminbi against the PBoC’s currency basket so far in August is 7.5% lower than during the second half of 2015, while global demand appears to be firming. A recent recovery in container freight rates, as measured by the Shanghai shipping exchange’s composite containerised freight index, is a promising sign – sixth chart.
Narrow money growth remains buoyant: the annual rise in true M1, comprising currency in circulation and demand / temporary deposits of non-financial enterprises, government organisations and households, edged up to 21.8% in July, the highest since 2010 – seventh chart*. It has been argued that demand deposits have been boosted by side-effects of the local government debt swap programme and rapid expansion of wealth management products but such explanations cannot account for the extent and persistence of recent strength. Household as well as corporate deposits have grown robustly – up by an annual 15.0% in July.
Annual growth of the broader M2 measure fell to 10.2% in July, a fifteen-month low, but the recent decline is entirely explained by deposits of non-bank financial institutions – these surged in 2014-15 but are now contracting. Swings in such deposits are unlikely to be relevant for assessing immediate economic prospects. M2 excluding financial-sector deposits, by contrast, has accelerated over the past year: annual growth of 12.3% in June was the strongest since 2013, with July little changed at 12.1% – seventh chart.
The preferred aggregates here, therefore, suggest that annual nominal GDP growth will continue to recover during the second half, following a rise from 6.0% to 7.3% between the third quarter of 2015 and the second quarter of 2016 – eighth chart.
*The official M1 aggregate omits household deposits.
 View Printer Friendly Version
 Email Article to Friend
Reader Comments