
Chinese economic outlook: near-term optimism maintained
 Simon Ward
 Post a Comment
Divergent US / Chinese narrow money trends last autumn suggested that the US economy would slow in early 2016 while Chinese growth would rebound, both contrary to consensus expectations at the time – see post from September. The US leg of this forecast has played out but Chinese activity has remained lacklustre. Chinese monetary trends are still viewed here as giving a positive signal for economic prospects, with the lack of a significant pick-up to date reflecting the normal variability of the lag between money changes and activity.
Most Chinese economic series have shown stability or modest improvement in recent months. The two manufacturing purchasing managers’ indices* remain below 50 but were higher over March-May than between July 2015 and February. Annual industrial output growth has moved sideways – 6.0% in May versus 5.9% in December. Annual retail sales growth has declined from 11.1% in December to a still-solid 10.0% in May, or 9.7% in volume terms. New residential construction is rising year-on-year after falling for most of 2015 – see first chart.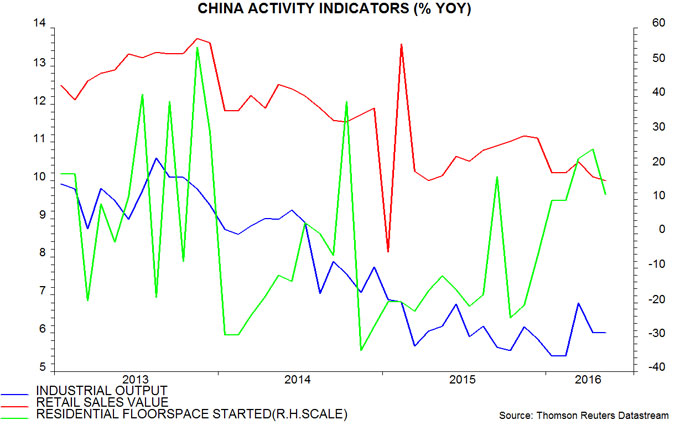
Total fixed asset investment, however, has disappointed, despite a surge in state-sponsored spending. Annual growth in private investment has continued to slow sharply, to just 1.0% in May (value terms) – second chart. This probably reflects a lagged response to profits weakness in 2015.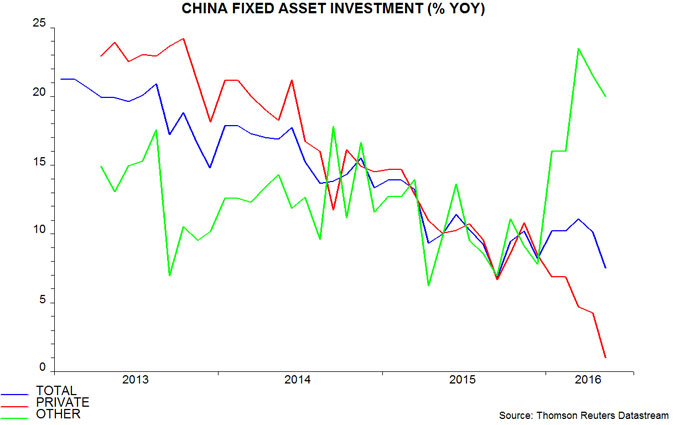
The official money measures are giving conflicting messages. Annual growth of M1 rose further to 23.7% in May, the highest since 2010, but M2 growth fell back to 11.8%, an 11-month low – third chart.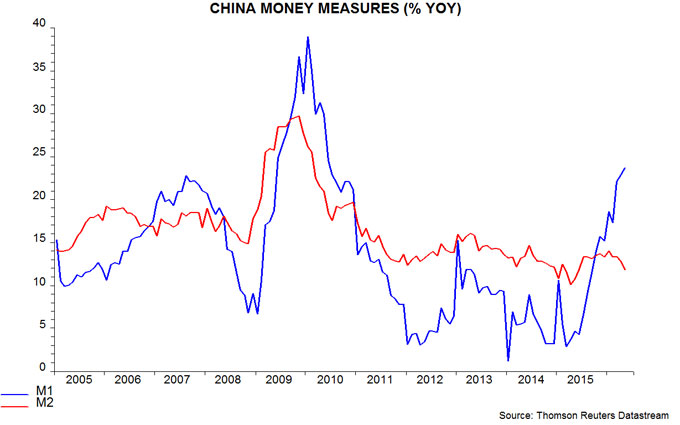
The official measures are regarded here as flawed. Chinese M1, contrary to global convention, includes only corporate demand deposits, excluding household holdings. M2, meanwhile, has been distorted in recent years by large swings in growth of financial deposits, which are of little significance for economic prospects. The preferred aggregates here are an expanded M1 measure incorporating household as well as corporate demand deposits – “true” M1 – and M2 excluding financial deposits. Annual growth of the two measures has risen significantly over the past year, i.e. they are giving a consistent positive directional signal for economic momentum – fourth chart.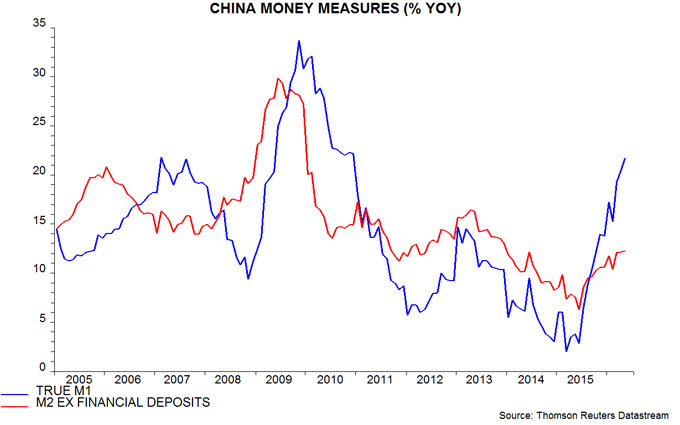
Some commentators have suggested that the relationship between narrow money and the economy has weakened or broken down. One prominent research group argued late last year that corporate demand deposits had been boosted by the local government debt swap programme; local governments, it was claimed, had passed the proceeds of bond sales to their related corporate entities, temporarily swelling the demand deposits of these entities pending their repayment of bank debt.
This “explanation” was regarded sceptically here, because detailed data showed that demand deposits of non-government-related corporations and households were also rising strongly. The failure of narrow money growth to subside in 2016 has cast further doubt on the story.
Another suggestion is that narrow money buoyancy reflects a rise in risk aversion and liquidity preference due to last year’s sharp fall in the stock market and more recent fears of a large devaluation of the exchange rate, i.e. it does not carry the usual implication of a rise in spending intentions. Stock prices, however, have stabilised since early 2016 while capital outflows have slowed significantly – any rise in narrow money demand due to increased risk aversion, therefore, should have reversed.
The view here is that the lack of a significant pick-up in economic growth to date reflects the normal variability of the lag in the relationship between money changes and activity. A study of G7 data over the past 50 years showed that turning points in narrow money preceded those in industrial output by nine months on average but with a plus / minus one standard deviation range of five to 13 months. Chinese narrow money growth started to surge in July 2015; the lack of a significant activity response by May 2016, 10 months later, is well within the bounds of historical experience.
The view that an economic pick-up is imminent is supported by a strengthening of several series that usually respond to monetary changes with a shorter lag than activity data. The annual rates of change of house prices and profits, for example, have risen since late 2015 – fifth chart. The pick-up in such “intermediate” variables is evidence that the monetary transmission mechanism is working normally. The recovery in profits, and continued corporate narrow money strength, suggest that the annual change in private investment is at or near a low.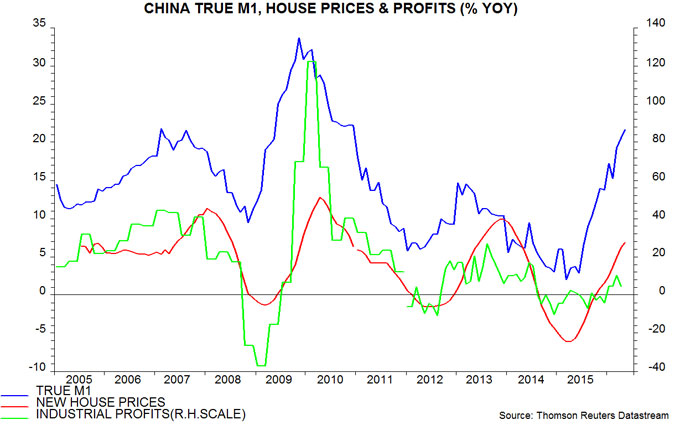
The OECDs composite Chinese leading indicator – which excludes monetary variables – provides further corroborating evidence of an improving outlook. The “ratio-to-trend” version of the indicator rose in March / April after a sustained fall between late 2013 and early 2016, implying a recovery in economic growth from below- to above-trend – sixth chart.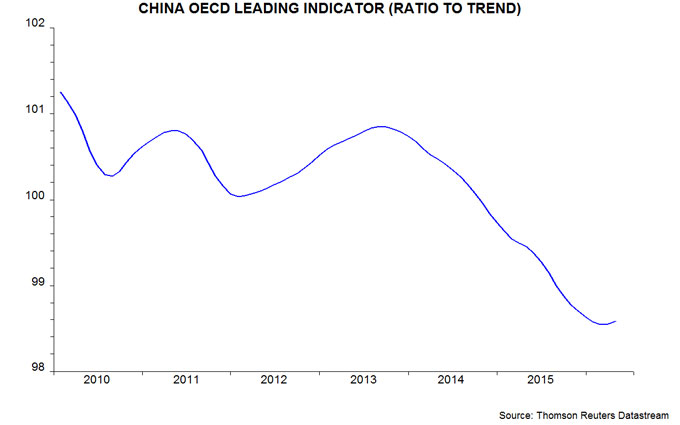
*National Bureau of Statistics and Markit / Caixin.
 View Printer Friendly Version
 Email Article to Friend
Reader Comments