Will the UK become a high-tax economy?
UK whole-economy output has surpassed its level in the 2007-08 financial year yet the budget deficit remains huge – a projected 5.5% of GDP on an underlying basis* in 2014-15, according to the Office for Budget Responsibility (OBR), compared with 2.6% in 2007-08. Why hasn’t economic recovery delivered commensurate fiscal improvement?
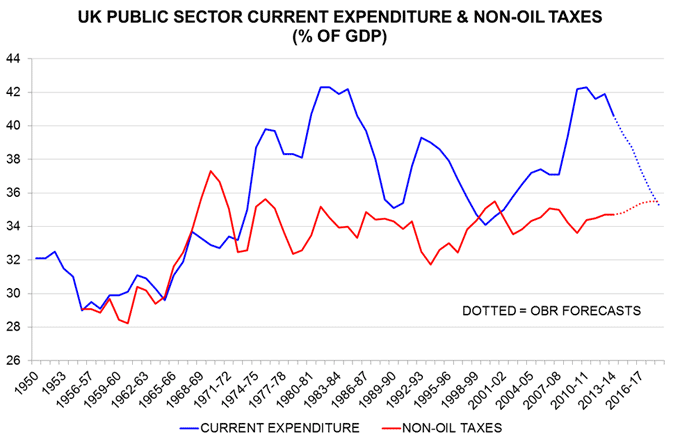
The main reason is that public current expenditure skyrocketed after 2007-08 and – despite “austerity” – has yet to return to earth. Current spending as proportion of GDP rose from 37.1% in 2007-08 to a peak of 42.3% in 2010-11. It was still 40.6% in 2013-14 and is projected to take another three years to reach the 2007-08 level – see chart. (The 2007-08 spending share was not historically low.)
The still-wide fiscal deficit cannot be attributed to a dearth of tax receipts. The share of non-oil taxes in GDP in 2013-14, at 34.7%, was above the average of 34.4% during Labour’s rule from 1997 to 2010. It is projected to rise to 35.5% by 2017-18 – a level matched or exceeded in only five years in British fiscal history.
Current fiscal plans involve a 1980s-scale cut in the spending share of GDP. The earlier reduction was delivered by Conservative governments with sizeable parliamentary majorities amidst a prolonged economic boom driven partly by strong credit expansion. A repeat performance, in other words, is unlikely. Instead, the next administration may try to close the fiscal gap by moving the tax share up to a continental European level – despite negative consequences for supply-side economic performance.
*Public sector net borrowing excluding temporary effect of financial interventions, APF and Royal Mail transfers.


Reader Comments (1)
Everyone in the country should see this chart it explains a lot. It show that (no matter what they try) 35% tax take is about the maximum that can be collect. It also shows since the 70's the government has been overspending yearly. The chart alone would show that it is not a taxing problem but a spending problem.