A small move higher in headline and core CPI inflation in April is consistent with the long-standing forecast here of a trend change from down to up in spring 2014 in lagged response to stronger monetary trends in 2012-13.
Posts in August and September last year argued that inflation would fall further in the short term, undershooting the Bank of England’s then forecasts significantly. The decline has been larger than expected, reflecting a stronger exchange rate and weaker global energy and food prices than had been assumed.
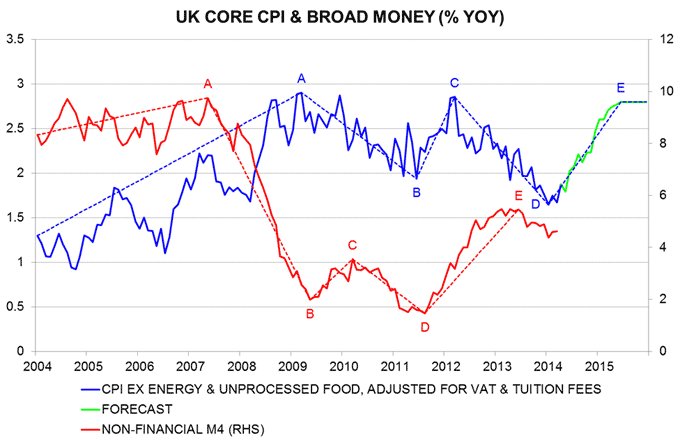
The first chart below is an update from the August post showing that major turning points in core inflation over the past decade have followed trend changes in broad money expansion roughly two years earlier, consistent with the Friedmanite rule. The core inflation measure tracked here* was expected to reach a low of 1.9% in late 2013 corresponding to a trough in money growth in late 2011. The decline extended slightly further and longer than expected, to 1.65% in January.
Core inflation, however, returned to 1.9% in April, a five-month high, and the monetarist rule suggests that it will now trend higher through mid-2015. With money growth rising by more in 2012-13 than in the prior 2009-10 upswing, it is reasonable to expect core inflation at least to regain its previous high of 2.8% next year, assuming that the drag from a strengthening exchange rate subsides.
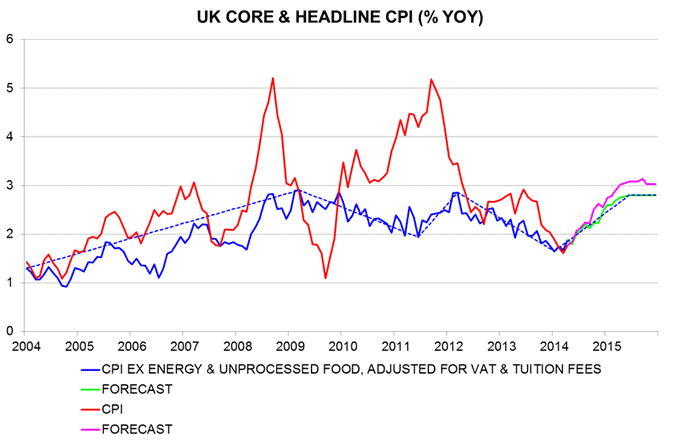
Headline inflation fell for longer and by more than the core rate because of favourable energy and food price trends in late 2013 / early 2014. Global energy and other industrial commodity prices are expected to firm along with economic growth over coming months. Food commodity prices have already recovered significantly, suggesting that CPI food inflation is at or close to a low.
Unprocessed food and motor fuel inflation is assumed to recover to 4% by early 2015, with household energy bills rising at the same rate. Together with the projected strengthening of core trends, this implies that the headline rate will return to 3% next year – second chart.
*The annual rate of change of the CPI excluding energy and unprocessed food, adjusted for the estimated impact of VAT changes and the large rise in undergraduate tuition fees from 2012.

