
Are the economy and markets approaching a peak?
 Simon Ward
 Post a Comment
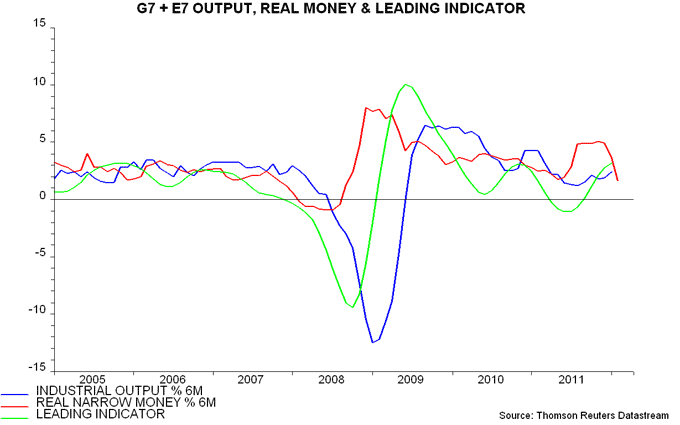
Six-month growth in G7 plus emerging E7 real narrow money topped out in November 2011 and available information suggests a further sharp fall in February – see first chart. Allowing for the typical six month lag between real money and economic activity, this is consistent with industrial output expansion peaking in May and slowing into the second half.
The forecast of a further pick-up in output momentum into May is supported by a shorter-term leading indicator derived from the OECD’s country leading indices. This indicator typically leads by three months and continued to rise in January, based on data released on Monday – first chart. If the monetary signal is correct, the indicator may peak in February, implying a March fall to be reported in mid May.
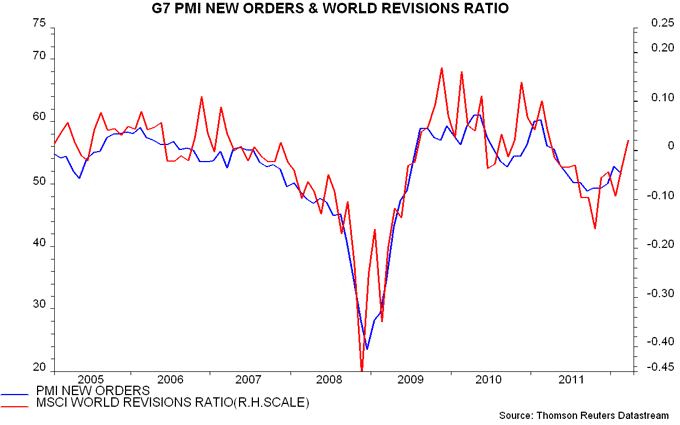
A further indication that near-term economic news may remain firm is that equity analysts are, on balance, revising up their company earnings forecasts. This, in turn, suggests that March manufacturing PMI results will be upbeat – second chart.
Growth peaks are usually associated with at least temporary declines in equities and other risk assets. Should investors cut risk exposure now in anticipation of an economic slowdown after May? Some reduction is probably warranted but it may be too early to position defensively, for three reasons.
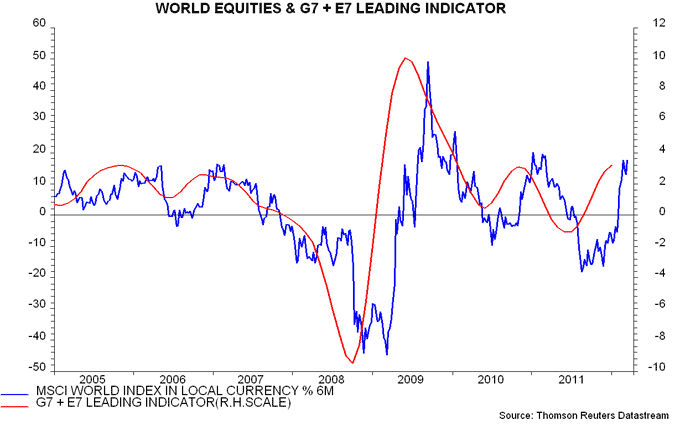
First, equity market tops have tended to coincide with or even lag growth peaks in recent years. A “safe” strategy has been to wait for the leading indicator to fall before cutting exposure, even allowing for the two-month publication lag – third chart. On this view, the earliest date to turn defensive is mid April in the event of a February indicator decline. As noted above, however, the monetary forecast favours March as the first month for a fall.
Secondly, equities, historically, have tended to rise as long as annual growth of global real narrow money exceeds that of industrial output, implying “excess” liquidity – this is still the case now. Six-month rates of expansion, however, have crossed, based on the provisional February real money number – first chart. This could presage a “sell” signal from the annual comparison in mid 2012.
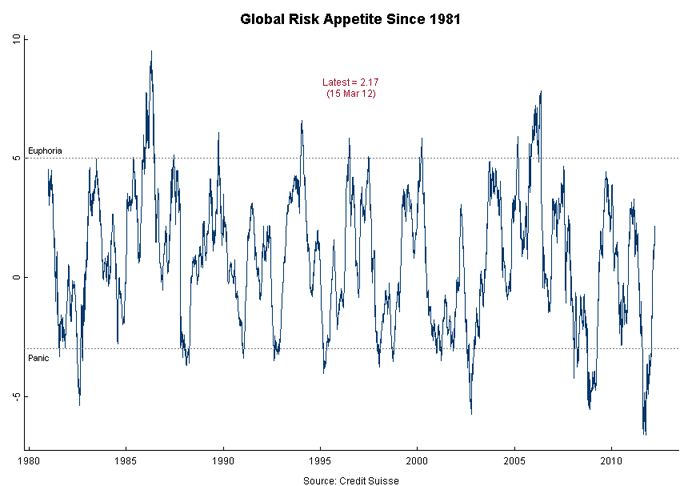
Thirdly, investor sentiment, while recovering dramatically since late 2011, has not yet reached an overbought extreme characteristic of major equity market tops, at least judging from the normally-reliable Credit Suisse risk appetite measure – fourth chart.
An additional argument for adopting a neutral posture is uncertainty over the monetary impact of the ECB’s liquidity injections – a pick-up in Eurozone real money growth could, in theory, temper or reverse the recent global slowdown. February money supply figures are released on 28 March and will be an important influence on the assessment here (though will not incorporate the impact of the second three-year LTRO conducted late last month).
 View Printer Friendly Version
 Email Article to Friend
Reader Comments