
Hard landing watch: US ISM manufacturing survey
 Simon Ward
 2 Comments
This is the second in a series of short posts focusing on whether incoming economic news supports or contradicts the forecast of a global “hard landing” suggested by monetary trends.
The US ISM manufacturing new orders index rose to a 13-month high of 49.2 in September, apparently supporting soft landing hopes.
A post in July flagged the possibility of a near-term rebound but suggested that this would prove to be a “head fake” preceding a move back below 45.
The main reason for expecting a recovery was that the stockbuilding cycle was judged to be moving towards a low, i.e. a drag on new orders from customer inventory adjustment was likely to abate.
The reason for expecting the recovery to be brief and followed by a relapse was that US real narrow money momentum remained heavily negative, suggesting that a stockbuilding boost would be outweighed by weakness in final demand.
Historical instances of ISM new orders recovering through 50 when real money contraction was negative include 1957, 1970, 1980 and 1990. The orders index subsequently fell back below 45, with the relapses associated with recessions – see chart 1.
Chart 1
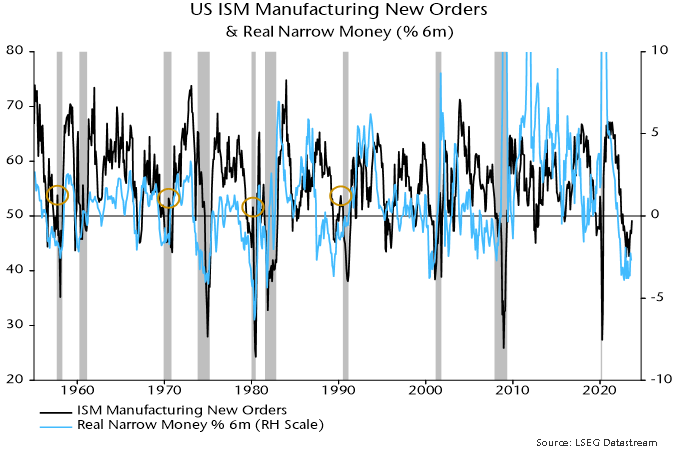
Six-month real narrow money momentum has recovered since mid-year but remains significantly negative.
The earlier suggestion of a recovery in ISM new orders was supported by a sharp rebound in Korean FKI manufacturing expectations between February and July – Korean exports are sensitive to changes in global industrial momentum. FKI expectations relinquished most of the February-July gain in August / September.
Verdict: inconclusive.
Eurozone / UK inflation tracking optimistic "monetarist" forecast
Eurozone / UK CPI momentum continues to normalise in line with the profile of broad money growth two years ago, a relationship suggesting a return of annual inflation to target in 2024 and an undershoot in 2025.
The six-month annualised rate of increase of Eurozone consumer prices (ECB seasonally adjusted measure) was stable at 3.3% in September but core momentum (i.e. excluding energy, food, alcohol and tobacco) posted another hefty fall from 4.0% to 3.4%, the lowest since January 2022 – see chart 1.
Chart 1
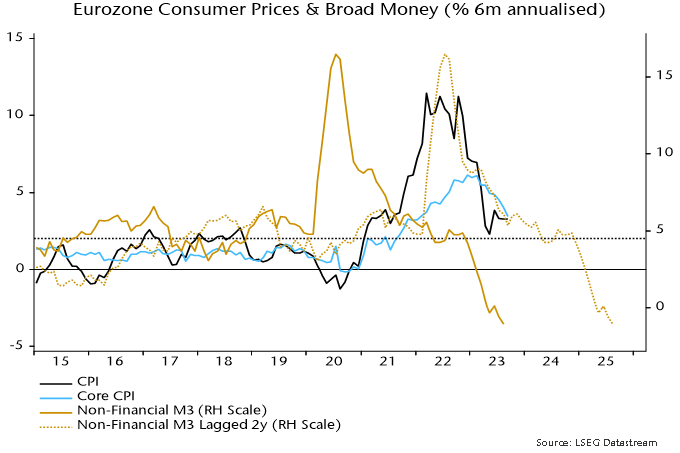
The current rates of increase are consistent with broad money momentum two years earlier: six-month growth of non-financial M3 had slowed significantly but still ran at about 6% annualised during H2 2021.
Broad money growth of 4-5% pa is compatible with the 2% inflation target over the medium term. (The ECB’s “reference value” for M3 growth under the now-demolished monetary pillar was 4.5% pa.) Six-month momentum moved into this range from Q2 2022, suggesting that the six-month rise in prices will return to about 2% annualised around Q2 2024, with annual inflation following later in the year.
The six-month rate of change of broad money broke decisively below 4% annualised in early 2023, moving into contraction in May. The message is that CPI momentum is on course to undershoot in 2025 unless the ECB reverses policy tightening and generates an early / significant rebound in money momentum.
The six-month annualised rate of increase of UK seasonally-adjusted consumer prices slowed sharply in August but was still above the Eurozone level, at 4.4% versus 3.3% – chart 2. UK and Eurozone six-month broad money growth was identical in August 2021 (6.1% annualised) but earlier strength had been more extreme in the UK, possibly contributing to higher current inflation.
Chart 2
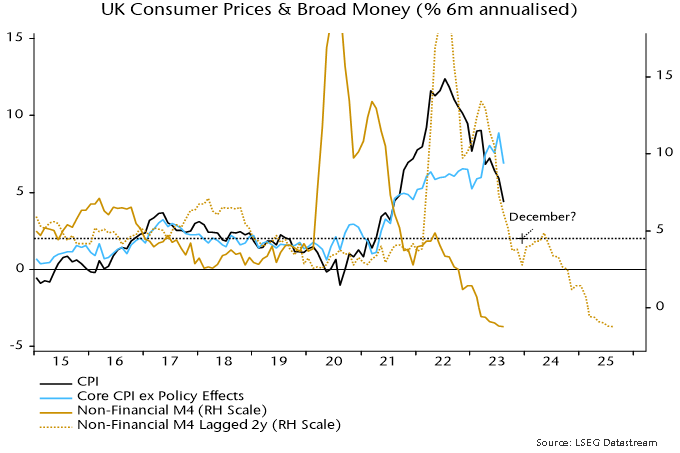
Six-month broad money momentum, however, fell more sharply in the UK than the Eurozone in late 2021, while the UK increase broke below 4% annualised six months earlier, in July 2022. The suggestion is that the UK inflation decline will catch up with or move ahead of Eurozone progress over the next six to 12 months.
Hard landing watch: September surveys
This is the first of a series of short posts focusing on whether incoming economic news supports or contradicts the forecast of a global “hard landing” suggested by monetary trends.
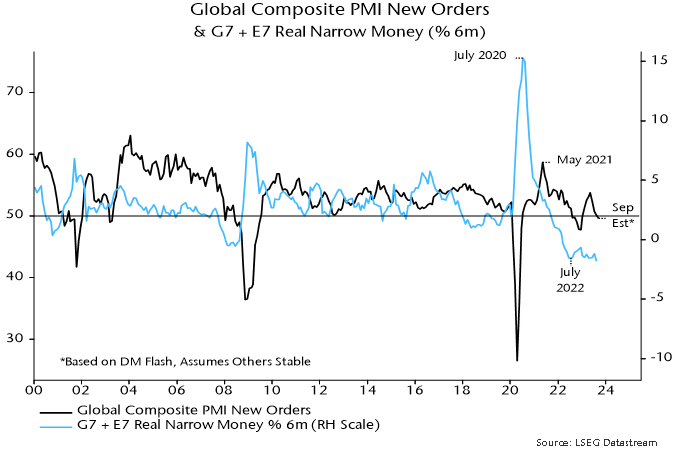
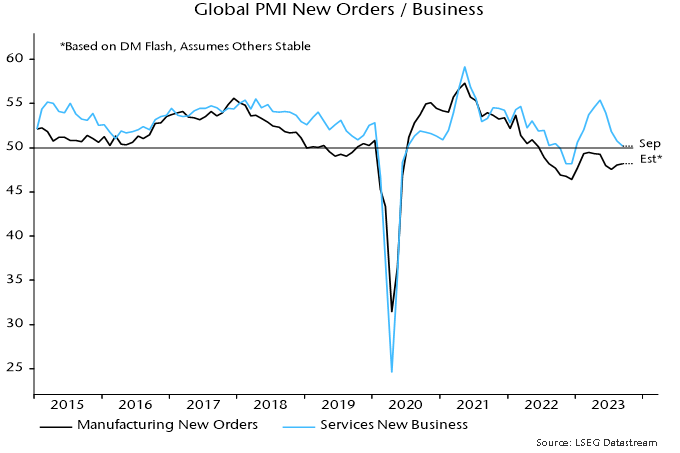
Flash results suggest that the global composite PMI new orders index – a timely indicator of demand momentum – fell for a fourth month in September, consistent with the monetary signal of a slide into early 2024, at least.
The flash results, available for the US, Japan, Eurozone, UK and Australia, imply a decline through 50 to the lowest level since December, assuming no change in all other countries in the global aggregate – see chart 1.
Chart 1
Weakness in the flash surveys was driven by a further slowdown in services new business, with manufacturing new orders little changed – chart 2.
Chart 2
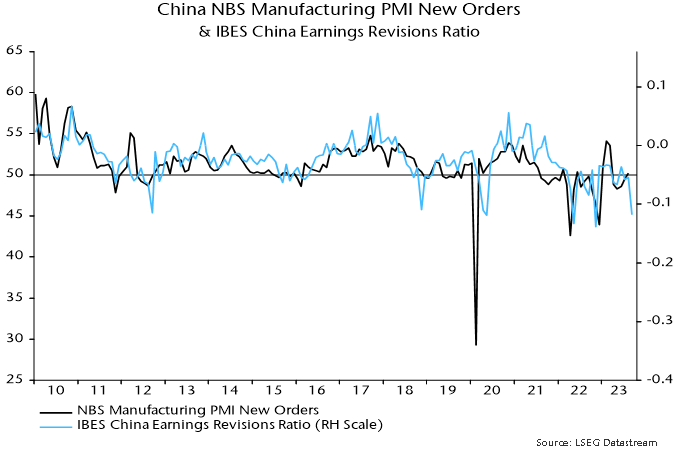
Any hopes of manufacturing stabilisation, however, may be dashed by full September results incorporating China and other emerging economies. The equity analysts’ earnings revisions ratio correlates with Chinese manufacturing PMI new orders and weakened sharply this month – chart 3.
Chart 3
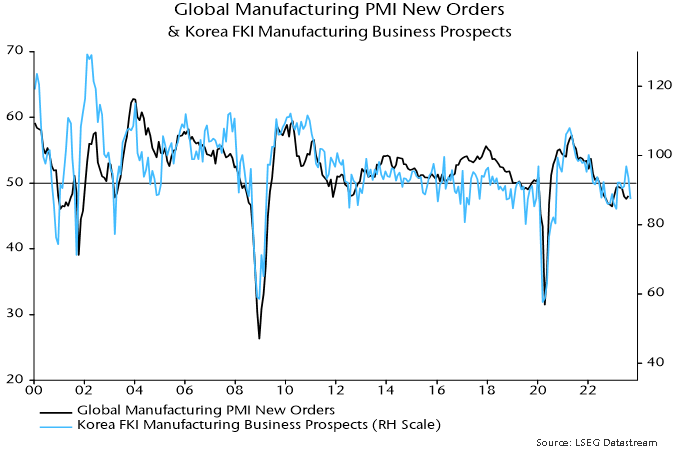
Renewed deterioration in Chinese / Asian manufacturing is also suggested by the Korean FKI survey for September, showing a relapse in the assessment of business prospects to the weakest since February – chart 4.
Chart 4
Monetary conditions still tightening
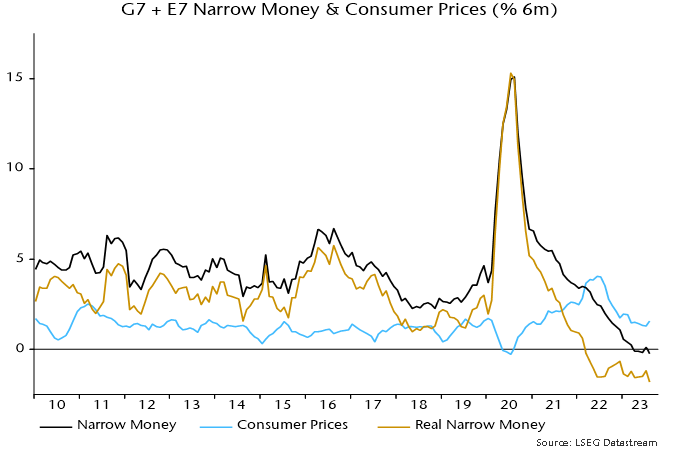
Global six-month real narrow money momentum is estimated to have broken to a new low in August, reinforcing pessimism here about economic prospects and casting strong doubt on now widely-held “soft landing” hopes.
Real money momentum bottomed in July 2022, recovered during H2 but suffered a relapse in early 2023, retesting the 2022 low in April. The relapse has been reflected in a renewed downswing in economic momentum, as proxied by global composite PMI new orders – see chart 1.
Chart 1
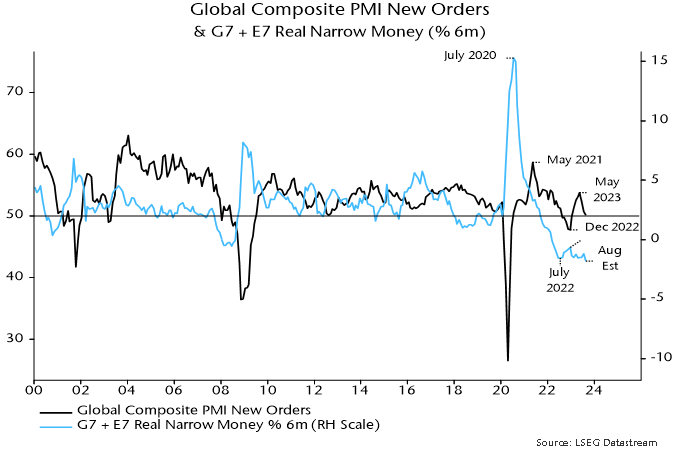
A tentative stabilisation of real money momentum over the summer suggested that PMI new orders would bottom out around year-end. The further move down in August, if confirmed, signals deeper and more extended economic weakness.
The August estimate is based on monetary data covering 70% the global (i.e. G7 plus E7) aggregate and near-complete CPI results.
The suggested fall to a new low reflects both additional nominal money weakness and an oil-price-driven recovery in six-month CPI momentum – chart 2.
Chart 2
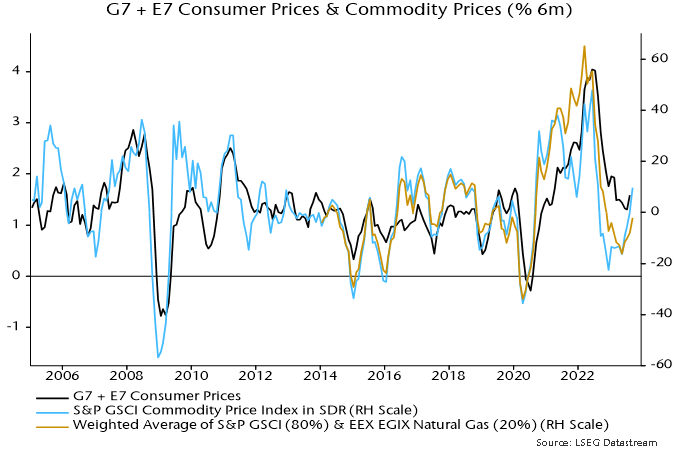
The ongoing oil price rally suggests a further near-term rise in headline CPI momentum – chart 3. A core slowdown, however, is expected to continue and may accelerate as higher oil costs squeeze spending on other items.
Chart 3
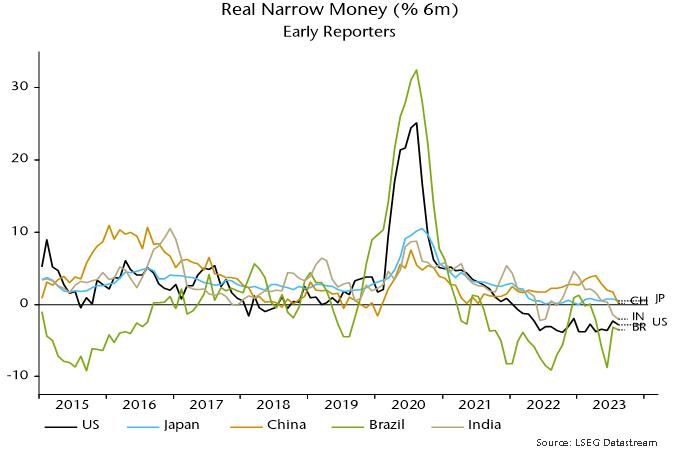
The further fall in real narrow money momentum has been driven mainly by China and India – chart 4. An earlier post attributed Chinese monetary weakness to misguided policy tightening in late 2022, which has since been partially reversed. Chinese August money numbers suggest greater damage from the misstep than previously assumed, implying a more urgent need for additional policy easing.
Chart 4
An August estimate of global industrial output is not yet available but a large negative differential between six-month rates of change of real narrow money and output is likely to have persisted – chart 5.
Chart 5
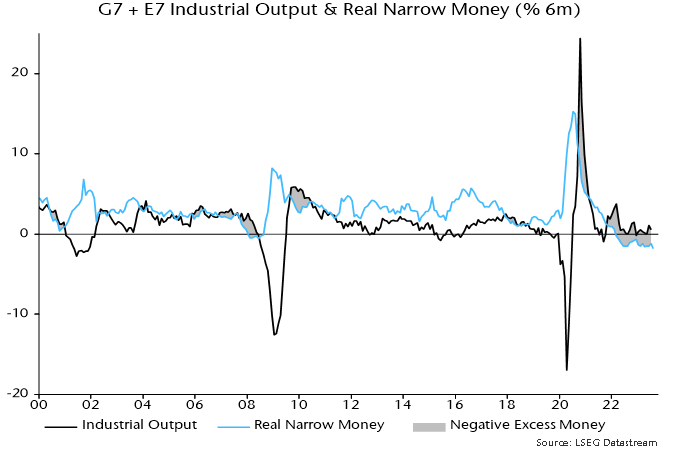
As previously noted, global equities have underperformed cash since this differential turned negative in early 2022 (allowing for reporting lags), despite a rally over the last 12 months.
Why was weakness compressed into the first nine months of 2022, with a subsequent strong rebound?
One explanation is that the Ukraine invasion and associated immediate further upward pressure on energy prices exaggerated the market response to monetary deterioration. Positioning and sentiment reached oversold extremes in late 2022, creating the potential for a relief rally as energy markets adjusted and prices fell back.
Another possibility – admittedly difficult to assess – is that the “excess” money backdrop has been less unfavourable than suggested by the six-month momentum differential shown in chart 5, because of the existence of an overhang from the 2020-21 monetary surge. An excess stock of money, in other words, may have persisted despite the flow turning negative.
The ratio of the stock of real narrow money to industrial output has trended higher over time, with the increase reflected in rising real asset prices and wealth – chart 6.
Chart 6
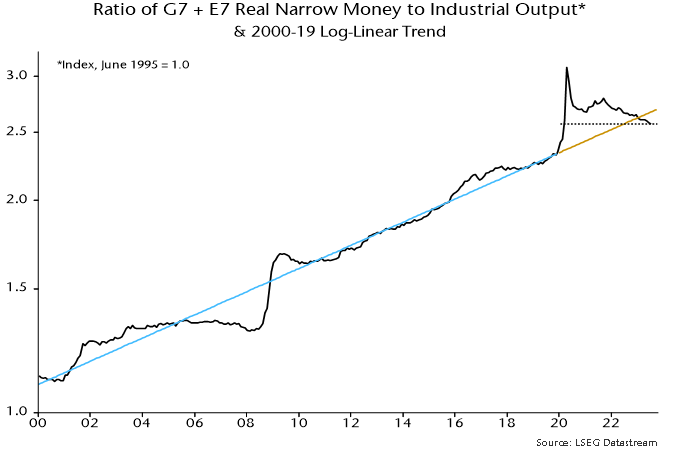
A huge overshoot in 2020-21 has been correcting since late 2021 but the ratio was still above its pre-pandemic trend at end-2022, i.e. the negative flow differential had not fully offset the prior period of excess.
The stock and flow signals, however, are now aligned: the real money / output ratio moved below trend in early 2023 and its July level was the lowest since February 2020 before the policy response to the pandemic and subsequent monetary surge.
UK labour market data weak not "mixed"
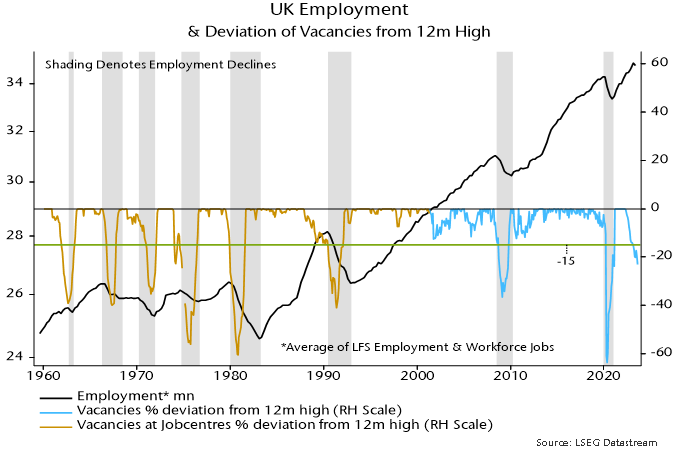
A post in May suggested that UK employment would embark on a sustained decline in Q2. This was based on the stock of vacancies having fallen 17% from its 12-month peak – declines of more than 15% historically were always associated with sustained employment falls.
Labour Force Survey employment fell by 207,000 in the three months centred on June from three months earlier, while the workforce jobs measure (of positions rather than people) was down by 153,000 between March and June.
Vacancies have continued to collapse, with the August stock down by 23% from its 12-month high and 29% below the April 2022 peak – see chart 1.
Chart 1
The three-month average unemployment rate, meanwhile, rose further to 4.3% in July versus an August 2022 low of 3.5%, confirming a Sahm rule recession signal (an increase of more than 0.5 pp from the 12-month minimum) – chart 2.
Chart 2
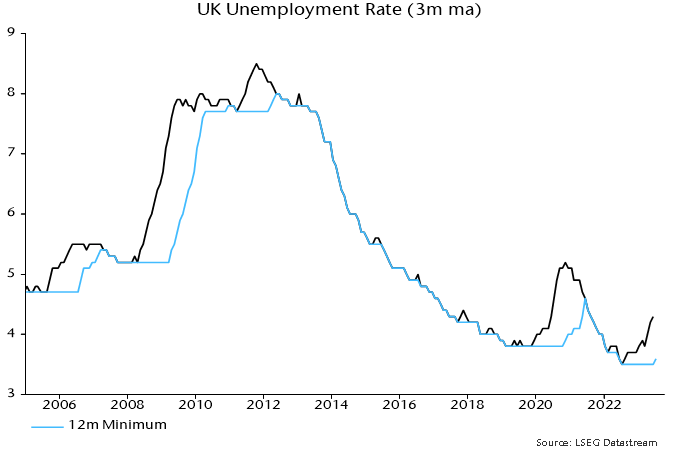
A July post noted that the Sahm rule has an imperfect record as an indicator of UK recessions but signals were always associated with a slowdown in average earnings growth.
Annual growth of regular earnings ticked down from 8.0% in June to 7.8% in July, while median pay growth in the more timely PAYE dataset eased to 6.7% in August – chart 3. (Caveat: the PAYE numbers are subject to significant revision.)
Chart 3

In light of the above, claims that the latest labour market news is “mixed” and shouldn’t deflect the MPC from another rate hike next week are odd and appear to reflect confirmation bias.
Money / credit contraction argues that current policy is much too restrictive. The ongoing collapse in vacancies and faster-than-expected deterioration in more lagging labour market indicators are consistent with this interpretation.
MPC member Catherine Mann argues for erring on the side of overtightening because rates can be cut swiftly if a mistake becomes apparent. If only the economic damage from bad policy-making were so easily reversed.